Maps API

  • Echtzeit-Satellitenbilder und Radardaten mit nahtloser, minutengenauer Animation, weltweit verfügbar
  • Atemberaubende Visualisierungen von verschiedenen Wettermodellen, Wetterstationsdaten und Windanimationen
  • Hochgradig anpassbare Wetterkarten mit High-Speed-Zugriff dank neuester Technologie und effizienter Datenverarbeitung
  • Anzeige verschiedener Höhenstufen für Temperatur-, Wind-, Wolken- und Luftdruckkarten ermöglicht eine technisch ausgefeilte Flugplanung
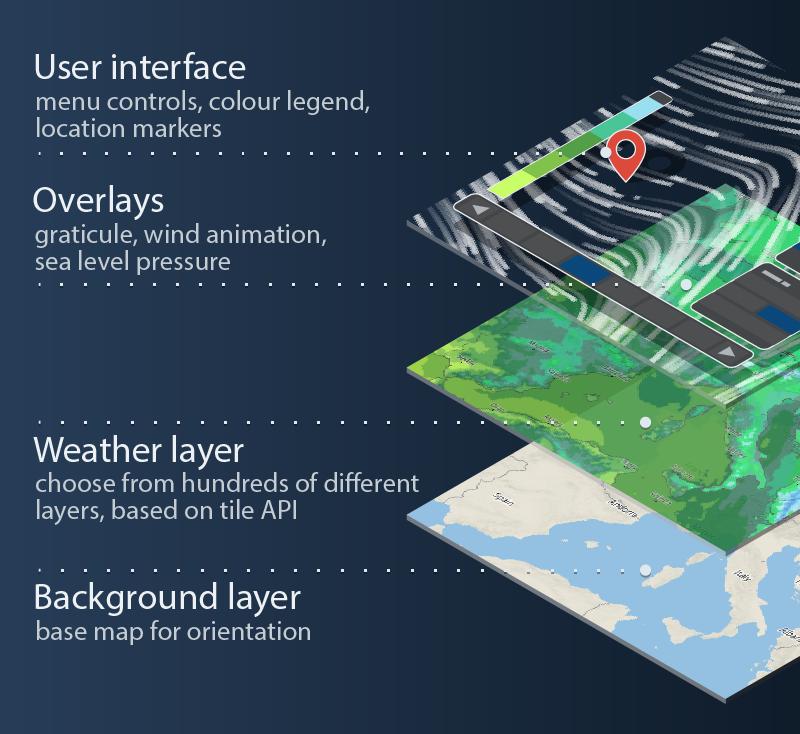
  • Einfach zu integrierende Plug-and-Play-Lösung für Ihre Webanwendung oder flexible Tile API für individuelle Lösungen

meteoblue Wetterkarten bieten eine große Auswahl an weltweit verfügbaren Wettervariablen, Datenquellen und Höhenstufen. Echtzeit-Satellitenbilder, Wetterradar und hochmoderne Animationen sorgen für perfekte Visualisierungen. Bereichern Sie Ihre Webanwendung in wenigen Minuten mit einem einfach zu integrierenden Plugin.

Sorgfältig ausgearbeitete Kartendesigns mit genau der richtigen Menge an Details gewährleisten eine hohe Benutzerfreundlichkeit und eine ansprechende visuelle Gestaltung sowohl für Gelegenheitsnutzer als auch für Experten. Die Auswahl der Farben, Beschriftungen, Konturen und verfügbaren Karten basiert auf einem tiefen Verständnis der Kartografie und der zugrunde liegenden Wetterdaten.

Map Tiles und offene Standards garantieren hohe Leistung und große Kompatibilität.
Einfach zu integrierendes Plugin

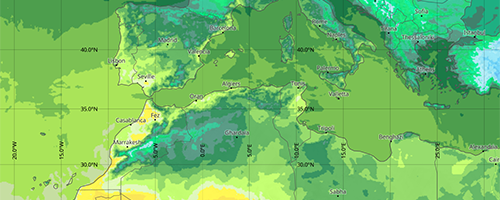
Das einfach zu integrierendes Plugin für Mapbox GL JS, welches im Hintergrund unsere Map Tiles API nutzt, bietet ein gebrauchsfertiges Web-Interface, ähnlich wie die Wetterkarten auf meteoblue.com. Die Windanimation wurde von Grund auf neu entwickelt, um eine unübertroffene Leistung und Detailgenauigkeit zu bieten. Die Satelliten- und Radarkarten zeigen aktuelle Wetterdaten in einer nahtlosen, minutengenauen Animation. Die Radaranimation enthält eine Vorhersage für eine bis zwei Stunden im Voraus.

Nachdem das Plugin einfach mit einem Skript-Tag eingefügt wurde, fügt es einer bestehenden Mapbox GL JS-Karte Steuerelemente für ein Kartenauswahlmenü, eine Zeitauswahl und eine Legende hinzu. Wählen Sie ganz einfach aus, welche Karten in der Navigation verfügbar sein sollen. Passen Sie das UI-Design an das visuelle Erscheinungsbild Ihrer Website an.

Die JavaScript-API bietet Methoden und Events, die denen von Mapbox GL JS ähneln, um kleine Anpassungen bis hin zum vollständigen Ersetzen der Standard-Benutzeroberfläche zu ermöglichen. Fügen Sie eigene Inhalte über die leistungsstarke Mapbox GL JS API hinzu, z. B. benutzerdefinierte HTML-Marker oder Popups.

meteoblue Weather Maps

Im folgenden Video erhalten Sie einen kurzen Überblick über die wichtigsten Features unserer Wetterkarten, wie z. B. die Satellitenanimation, den Radar-Layer und andere wichtige Features der Kartenoberfläche.

Beispiele

 1
 2
 3
 4
 5
 6
 7
 8
 9
10
11
12
13
14
15
16
17
18
19
20
21
22
23
24
25
26
27
28
29
<script src="https://static.meteoblue.com/cdn/mapbox-gl-js/v1.11.1/mapbox-gl.js"></script>
<link rel="stylesheet" href="https://static.meteoblue.com/cdn/mapbox-gl-js/v1.11.1/mapbox-gl.css" target="_blank" rel="noreferrer">

<script src="https://static.meteoblue.com/lib/maps-plugin/v0.x/maps-plugin.js"></script>

<div id="map_container" style="height: 500px; width: 100%;"></div>

<script>
    const mapboxMap = new mapboxgl.Map({
        container: "map_container",
        center: [7.57327, 47.5584],
        zoom: 5,
        minZoom: 0,
        maxZoom: 24,
        hash: false,
        attributionControl: false,
        keyboard: false,
    });

    const apiKey = "DUMMYAPIKEY";
    const inventoryUrl = "https://maps-api.meteoblue.com/v1/map/inventory/weather-maps?lang=en&apikey=" + apiKey + "&temperatureUnit=CELSIUS&velocityUnit=KILOMETER_PER_HOUR&lengthUnit=metric";

    new meteoblueMapsPlugin({
        mapboxMap: mapboxMap,
        inventory: inventoryUrl,
        apiKey: apiKey,
        canUseRestricted: true,
    });
</script>
 1
 2
 3
 4
 5
 6
 7
 8
 9
10
11
12
13
14
15
16
17
18
19
20
21
22
23
24
25
26
27
28
29
30
31
32
33
34
35
36
37
38
39
40
41
42
43
44
45
46
47
48
49
50
<script src="https://static.meteoblue.com/cdn/mapbox-gl-js/v1.11.1/mapbox-gl.js"></script>
<link rel="stylesheet" href="https://static.meteoblue.com/cdn/mapbox-gl-js/v1.11.1/mapbox-gl.css" target="_blank" rel="noreferrer">

<script src="https://static.meteoblue.com/lib/maps-plugin/v0.x/maps-plugin.js"></script>
                
<style>
    /* Custom Maps Plugin styling is done trough CSS variables */
    .maps-custom-design {
        --meteoblue-mapsplugin-background-primary: rgba(226, 226, 226, 0.692);
        --meteoblue-mapsplugin-background-highlight: rgba(255, 255, 255, 0.746);
        --meteoblue-mapsplugin-background-highlight-secondary: rgba(255, 255, 255, 0.897);
        --meteoblue-mapsplugin-color-primary: rgb(0, 0, 0);
        --meteoblue-mapsplugin-color-progress-bar: rgba(138, 138, 138, 0.883);
        --meteoblue-mapsplugin-color-link-hover: rgb(45, 77, 255);
        --meteoblue-mapsplugin-color-toggle: rgb(90, 90, 90);
        --meteoblue-mapsplugin-border: 1px solid rgb(156, 156, 156);
        --meteoblue-mapsplugin-border-radius: 20px;
        --meteoblue-mapsplugin-text-shadow: 0 0 5px rgb(255, 255, 255);
        --meteoblue-mapsplugin-icon-arrow: url("data:image/svg+xml;charset=utf-8,%3Csvg xmlns='http://www.w3.org/2000/svg' height='10' viewBox='0,0,20,21' width='11'%3E%3Cpath fill='black' d='M0 3l3-3 8 12 7-12 3 3-10 17z'/%3E%3C/svg%3E");
        --meteoblue-mapsplugin-icon-close: url("data:image/svg+xml,%3Csvg xmlns='http://www.w3.org/2000/svg' xmlns:xlink='http://www.w3.org/1999/xlink' width='10' height='10' viewBox='0 0 10 10'%3E%3Cpath fill='black' d='M9.988,8.543 C9.988,8.543 8.543,9.988 8.543,9.988 C8.543,9.988 5.000,6.445 5.000,6.445 C5.000,6.445 1.457,9.988 1.457,9.988 C1.457,9.988 0.012,8.543 0.012,8.543 C0.012,8.543 3.554,5.000 3.554,5.000 C3.554,5.000 0.012,1.457 0.012,1.457 C0.012,1.457 1.457,0.012 1.457,0.012 C1.457,0.012 5.000,3.554 5.000,3.554 C5.000,3.554 8.543,0.012 8.543,0.012 C8.543,0.012 9.988,1.457 9.988,1.457 C9.988,1.457 6.445,5.000 6.445,5.000 C6.445,5.000 9.988,8.543 9.988,8.543 Z' fill-rule='evenodd' /%3E%3C/svg%3E");
        --meteoblue-mapsplugin-icon-play: url("data:image/svg+xml;charset=utf-8,%3Csvg xmlns='http://www.w3.org/2000/svg' height='10' viewBox='0,0,20,21' width='11'%3E%3Cpath fill='black' d='M 0 0 L 20 11 0 21 z'/%3E%3C/svg%3E");
        --meteoblue-mapsplugin-icon-stop: url("data:image/svg+xml;charset=utf-8,%3Csvg xmlns='http://www.w3.org/2000/svg' height='10' viewBox='0,0,20,21' width='11'%3E%3Cpath fill='black' d='M 0 0 L 8 0 8 21 0 21 M 12 0 L 20 0 20 21 12 21 z'/%3E%3C/svg%3E");
        --meteoblue-mapsplugin-icon-menu: url("data:image/svg+xml;charset=utf-8,%3Csvg xmlns='http://www.w3.org/2000/svg' height='10' viewBox='0,0,20,21' width='11'%3E%3Cpath stroke='black' stroke-width='4' d='M 0 2 L 20 2 M 0 10 L 20 10 M 0 18 L 20 18 z'/%3E%3C/svg%3E");
    }
</style>

<div id="map_container" class="maps-custom-design" style="height: 500px; width: 100%;"></div>

<script>
    const mapboxMap = new mapboxgl.Map({
        container: "map_container",
        center: [7.57327, 47.5584],
        zoom: 5,
        minZoom: 0,
        maxZoom: 24,
        hash: false,
        attributionControl: false,
        keyboard: false,
    });

    const apiKey = "DUMMYAPIKEY";
    const inventoryUrl = "https://maps-api.meteoblue.com/v1/map/inventory/filter?lang=en&apikey=" + apiKey + "&maps=satellite,radar,temperature,sunshine,wind,humidity,gph500,apparentTemperature,soilTemperature,precipitationDaily,visibility,airQualityIndex,temperatureAnomaly,uvIndex,obsTemperature,obsPrecipitation&temperatureUnit=CELSIUS&velocityUnit=KILOMETER_PER_HOUR&lengthUnit=metric&overlays=pressure2mOverlay";

    new meteoblueMapsPlugin({
        mapboxMap: mapboxMap,
        inventory: inventoryUrl,
        apiKey: apiKey,
        canUseRestricted: true,
    });
</script>
  1
  2
  3
  4
  5
  6
  7
  8
  9
 10
 11
 12
 13
 14
 15
 16
 17
 18
 19
 20
 21
 22
 23
 24
 25
 26
 27
 28
 29
 30
 31
 32
 33
 34
 35
 36
 37
 38
 39
 40
 41
 42
 43
 44
 45
 46
 47
 48
 49
 50
 51
 52
 53
 54
 55
 56
 57
 58
 59
 60
 61
 62
 63
 64
 65
 66
 67
 68
 69
 70
 71
 72
 73
 74
 75
 76
 77
 78
 79
 80
 81
 82
 83
 84
 85
 86
 87
 88
 89
 90
 91
 92
 93
 94
 95
 96
 97
 98
 99
100
101
102
103
104
105
106
107
108
109
110
111
112
113
114
115
116
117
118
119
120
121
122
123
124
125
126
127
128
129
130
131
132
133
134
135
136
137
138
139
140
141
142
143
144
145
146
147
148
149
150
151
152
153
154
<script src="https://static.meteoblue.com/cdn/mapbox-gl-js/v1.11.1/mapbox-gl.js"></script>
<link rel="stylesheet" href="https://static.meteoblue.com/cdn/mapbox-gl-js/v1.11.1/mapbox-gl.css" target="_blank" rel="noreferrer">

<script src="https://static.meteoblue.com/lib/maps-plugin/v0.x/maps-plugin.js"></script>

<style>
    .custom-menu {
        margin: 0 auto;
        display: flex;
        flex-direction: column;
        justify-content: end;
        position: absolute;
        top: 0;
        right: 0;
        bottom: 0;
        left: 0;
        align-items: center;
        font-size: 1.5em;
    }

    .map-selection, .time-selection {
        pointer-events: initial;
        background: rgba(226, 226, 226, 0.692);
        display: flex;
        border-radius: 5px;
        overflow: hidden;
        width: max-content;
        align-content: center;
        border: 1px solid rgb(109, 109, 109);
    }

    .map-selection .active {
        background: rgb(250, 250, 250);
    }

    .time-selection {
        padding: 0.25em;
        margin-top: 0.5em;
    }

    .map-selection div, .time-selection button {
        cursor: pointer;
        padding: 0.5em;
    }

    .date-display {
        display: flex;
        align-items: center;
        padding: 0 0.5em;
    }
</style>

<div id="map_container" style="height: 500px; width: 100%;"></div>

<script>
    const inventoryUrl = "https://maps-api.meteoblue.com/v1/map/inventory/filter?lang=en&apikey=" + apiKey + "&maps=temperature,sunshine&temperatureUnit=CELSIUS&velocityUnit=KILOMETER_PER_HOUR&lengthUnit=metric&overlays=pressure2mOverlay,graticuleOverlay";
    const apiKey = "DUMMYAPIKEY";

    // Map Selection

    const mapSelection = document.createElement('div');
    mapSelection.classList.add('map-selection');
    
    const temperature = document.createElement('div');
    temperature.innerText = 'Temperature';
    temperature.id = 'temperature';
    temperature.classList.add('active')
    mapSelection.appendChild(temperature);

    const sunshine = document.createElement('div');
    sunshine.innerText = 'Sunshine';
    sunshine.id = 'sunshine';
    mapSelection.appendChild(sunshine);


    // Time Selection

    const customMenu = document.createElement('div');
    customMenu.classList.add('custom-menu');

    const prevButton = document.createElement('button');
    prevButton.disabled = true;
    prevButton.innerText = 'Previous';

    const nextButton = document.createElement('button');
    nextButton.innerText = 'Next';

    const dateDisplay = document.createElement('div');
    dateDisplay.classList.add('date-display');

    const timeSelection = document.createElement('div');
    timeSelection.classList.add('time-selection');
    timeSelection.appendChild(prevButton);
    timeSelection.appendChild(dateDisplay);
    timeSelection.appendChild(nextButton);

    const mapboxMap = new mapboxgl.Map({
        container: "map_container",
        center: [7.57327, 47.5584],
        zoom: 5,
        minZoom: 0,
        maxZoom: 24,
        hash: false,
        attributionControl: false,
        keyboard: false,
    });

    const mapsPlugin = new meteoblueMapsPlugin({
        mapboxMap: mapboxMap,
        inventory: inventoryUrl,
        apiKey: apiKey,
        canUseRestricted: true,
        showSidebar: false,
        showTimeSelection: false,
        content: {
            main: customMenu,
        }
    });

    function changeMap(event) {
        Array.from(mapSelection.children)
            .forEach(child => child.classList.remove('active'));
        event.target.classList.add('active');

        mapsPlugin.setMap({map: event.target.id});
    }

    function changeDateBy(numSteps) {
        const timeSteps = mapsPlugin.getTimeInfo().categories;
        const current = mapsPlugin.getDate();
        const currentIndex = timeSteps.findIndex(category => category === current);

        const maxIndex = timeSteps.length - 1;
        const newIndex = Math.min(Math.max(currentIndex + numSteps, 0), maxIndex);
        const newDate = timeSteps[newIndex].value;

        prevButton.disabled = newIndex === 0;
        nextButton.disabled = newIndex === maxIndex;

        dateDisplay.innerText = newDate;
        mapsPlugin.setDate(newDate);
    }
    
    mapsPlugin.on('load', () => {
        mapSelection.addEventListener('click', changeMap)

        dateDisplay.innerText = mapsPlugin.getDate().value;
        prevButton.addEventListener('click', () => changeDateBy(-1));
        nextButton.addEventListener('click', () => changeDateBy(+1));

        customMenu.appendChild(mapSelection);
        customMenu.appendChild(timeSelection);
    })
</script>

Flexible Tile API

Nutzen Sie die zugrunde liegende Low-Level Tile API für vollständig angepasste Lösungen. Sie bietet standardmäßige Vektor- und Raster-Tile-Formate, die mit allen gängigen Mapping-Bibliotheken, wie Mapbox GL JS, Leaflet, OpenLayers und anderen, kompatibel sind.

Die API unterstützt über 80 verschiedene Wettervariablen, mehrere Wettermodelle und verschiedene Höhenstufen, einzelne Zeitschritte und Aggregationen, vollständig anpassbare Konturschritte (z. B. 2 °C oder 4 °C Temperaturschritte) und anpassbare Kartenfarben sowie mehrere Maßeinheiten.

Die meteoblue Maps API erfordert mindestens die Zugangsstufe Access Silver. Weitere Informationen zu den Preisen der Maps API finden Sie auf der API-Preisseite. Wenn Sie nach einer kostenlosen Lösung für die Implementierung von Karten in Ihre Website suchen, beachten Sie bitte unser kostenloses Wetterkarten Widget.

Weitere technische Informationen finden Sie in unserer technischen Dokumentation für das Maps Plugin, die Tile API und den Maps API Konfigurator.

  
×

Commercial request

meteoblue offers a wide range of products and solutions for commercial use in many different sectors and industries.

Please fill out the fields below in order to send us your request. Our experts will reply within a few business days.

The form was sent successfully.

Thank you for getting in touch, our experts will contact you within a few business days.