
Town planning scenarios
Urban planning scenario tools allow decision-makers to decide on the most effective climate change mitigation actions. The expenses for the city can be significantly reduced if the appropriate decisions are taken.
- Climate change adaptation and mitigation measures
- Surface de-sealing, urban greening, white asphalt utilisation, irrigation
- SUEWS models for urban climate - Surface Urban Energy Water-balance Scheme
Due to sealed surfaces (e.g., concrete or pavement), cities contribute to their own warming. For example, surface sealing prevents the soaking of water which could later evaporate, cooling the environment in the process. Instead, the surface absorbs short-wave solar radiation, and later releases it in the form of heat. The lack of ventilation caused by compact urban development prevents the circulation of air masses, and consequently the cooling of urban areas. These are just some of the factors that influence urban climate, and lead to a general warming of the city.
It is also clear that there are various ways of changing the climate in the city through adaptation measures. Some of the most are rooftop greening and facade greening, utilisation of white asphalt, de-sealing of surfaces, or irrigation.
The de-sealing of surfaces can be a very effective adaptation measure when water-permeable areas cover a large part of the city. When the surfaces are sealed, rainwater can no longer soak in and evaporate again later, which would contribute to cooling. Instead, the sealed surfaces heat up, and contribute to the overall warming of the city. De-sealing can restore the soil’s natural functions and percolation capability, making the surfaces more resilient to flooding. Unsealed surfaces can be either greened or graveled. The additional vegetation in turn contributes to the cooling of the city. The canopy of trees reduces the sunlight reaching the ground, i.e., the shade keeps the ground cool and can increase thermal comfort. In addition, vegetation can have a range of benefits for the microclimate through evapotranspiration or regulation of air movement, and better conditions for living organisms.
This service explores the impact of the climate change adaptation measures implemented with the IoT measurement network. Point-specific analysis of changing air temperature and surface temperatures is conducted, based on proven surface energy balance models (SUEWS, or the Surface Urban Energy Water-balance Scheme). Within this service, more than 20 different climate change mitigation strategies can be tested.
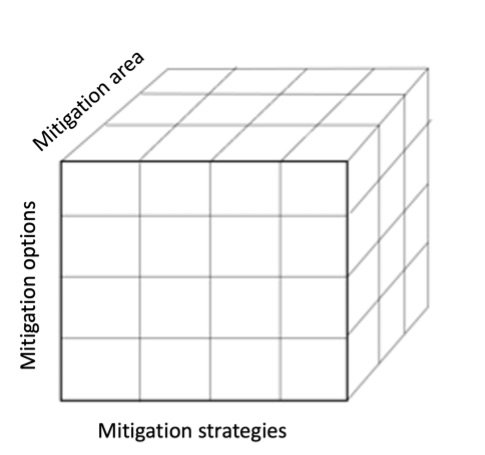
The reduction of both surface temperature and air temperature (compared to the current state) is calculated by SUEWS models for various climate change adaptation measures. The analysis concentrates on particularly hot areas in the city. This way, four different strategies with different options will be used (see the table below), while different sizes of adaptation measures are simulated.
| Blue strategies | Green strategies | Measures on buildings | Technical measures to change the material properties |
|---|---|---|---|
| Irrigation of green areas | Roof greening | Facade greening | Heat insulation roof materials (cool roofs) |
| Construction of fountains and water areas | Planting of new trees | Climate change adapted materials on buildings | Climate change adapted materials for asphalt (cool pavements) |
| Implementation of new green areas | White streets |
The analysis differentiates by the time of day, the season, as well as a range of atmospheric conditions (such wind conditions, cloud cover, and heat days). Coupling with climate change emission scenarios (from IPCC report) makes it possible to compare the current conditions with the expected conditions from 2050 (optionally 2085). This way, the different impacts of climate change, with and without adaption measures, can be estimated. Data is provided via a web repository (e.g., OneDrive) as csv files and png files (or similar). This service can also distinguish between one-dimensional (1D) point-specific analyses, and two-dimensional (2D) area-analyses.
Whilst 1D analyses focus on one specific and representative location, the 2D analyses cover an area for which climate change adaption measures are combined.
The results are then presented to the city representatives so that they can decide on the most desirable measures for climate adaptation, which can be afterwards implemented by the city.
Technical approach
The analysis is conducted via SUEWS, based on air temperature measurements in the surrounding of the area of interest. The analysis provides results for the surface temperature and the air temperature.
Firstly, a reference simulation of the current state of the area is carried out. In addition, multiple “sensitivity runs” are subsequently conducted, in which the surface of the area is artificially modified. Artificial surface modification changes important surface-specific material properties such as albedo, emissivity, thermal conductivity, and others.
The differences (before – after) in the variables of surface temperature and air temperature are determined by a difference calculation.
ΔT=Tsens-Tref
where Tsens is the temperature of the sensitivity run (after adaption) and Tref is the temperature of the reference simulation (before adaption).
(Note: In the graph, mitigation strategies are demonstrated instead of adaption strategies).
In total, 3 different groups of parameters can be changed:
- The climate change adaption strategy
- The climate change adaption option
- The extent of the adjustment measure
In order to test the effectiveness of the planned climate change adaptation measure, the area of the adaptation can be adjusted for size within the model. This allows questions to be answered, for example, how the temperature reduction changes if the considered area is doubled or halved. The temperature reduction due to the adaptation measure is simulated for the area of the adaptation measure, and then extrapolated to the entire area.
Surface temperature and air temperature are displayed for the following conditions:
- Time of day: day vs. night conditions
- Seasons: summer vs. winter conditions
- Radiation: cloudy vs. sunny conditions
- Wind: windy conditions vs. no wind
- Current conditions vs. conditions in 2050
- All results will be presented in the form of charts, maps or tables with trends, extremes and frequency distributions.
