Risk monitoring
Relevant links
Features
Technical documentation
More free offers
- Maximizing annual yields with optimised risk monitoring of your farm
- Improve scheduling of sowing and spraying activities with our meteogram images
- Follow up the growth of your plants with weather based growth models
- Cost efficient management of field irrigation with highest precision precipitation forecast
- Assess plant disease infection risk with sophisticated leaf wetness forecasting
- High resolution weather models assure accuracy in complex terrains
- Plug & play solution for your business case
- Numerous variables for any specific site worldwide
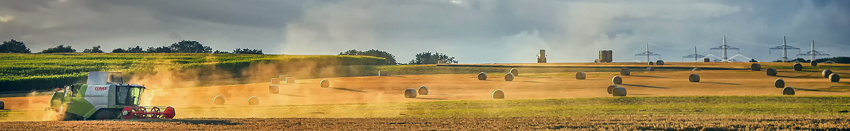
With globally consistent, high quality weather data, you can ensure optimal scheduling, early risk detection and maximum yields.
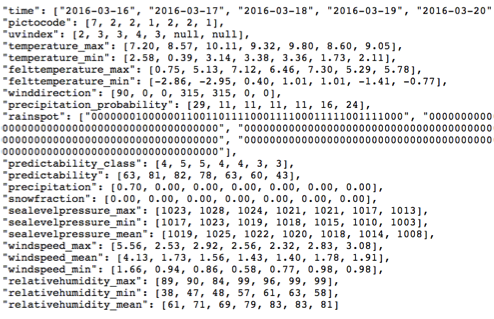
Weather APIs
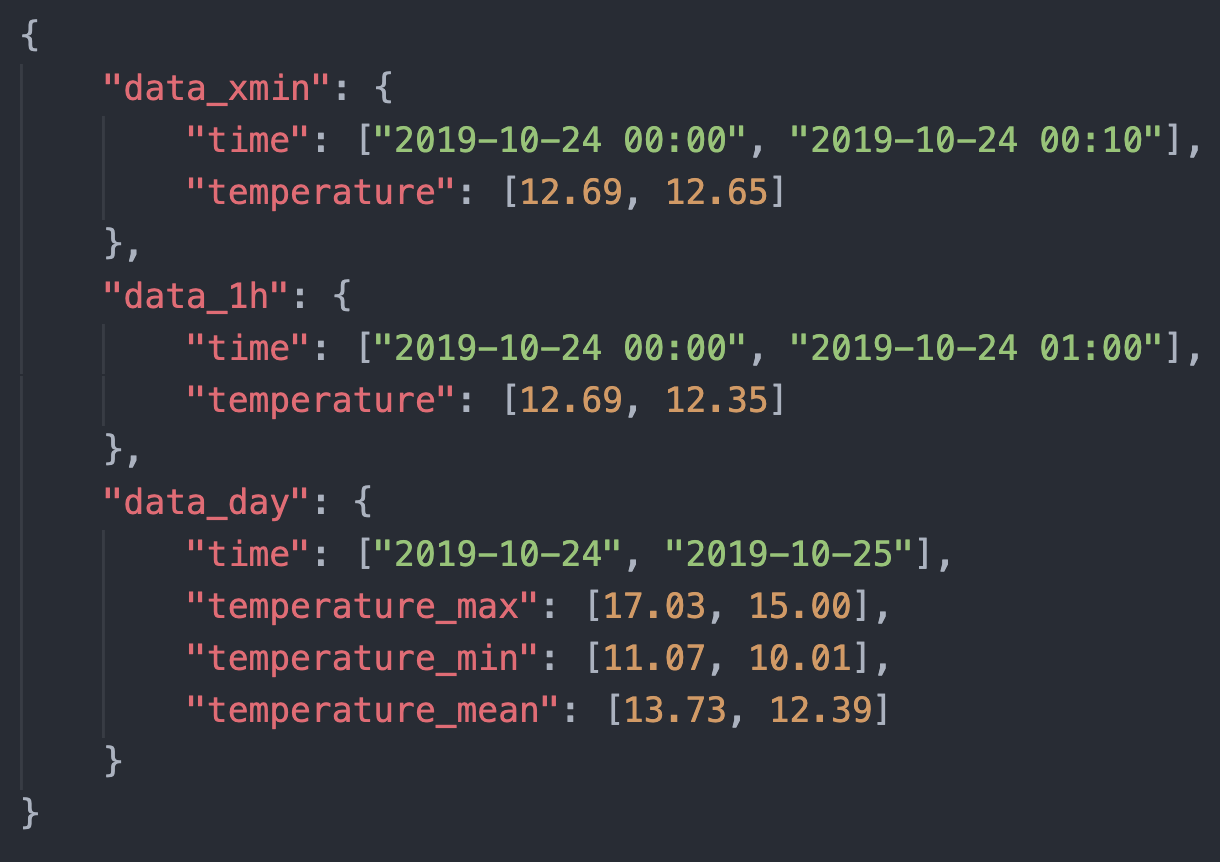
Package API Our recommended solution to integrate weather data in your application
For agricultural purposes we recommend using our high-speed History API for easy retrieval of an extensive selection of weather variables ranging from wind speed and sunshine time to soil moisture and dew point temperature.
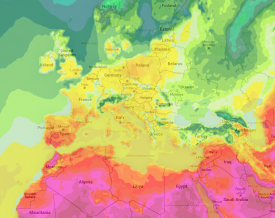
Maps API Fully customizable integration of our stunning weather maps
meteoblue offers various layers of our weather maps, that can easily be integrated into your farm management system. All maps are available through the meteoblue API and on the meteoblue website. The meteoblue API delivers the maps as graphics in PNG format that have to be implemented on a map (for example GoogleMaps).
For agricultural purposes we recommend the following layers:
- Radar animation
- Precipitation Probability
- Wind Animation
- Freezing level height
- Dewpoint Temperature
- Soil Moisture
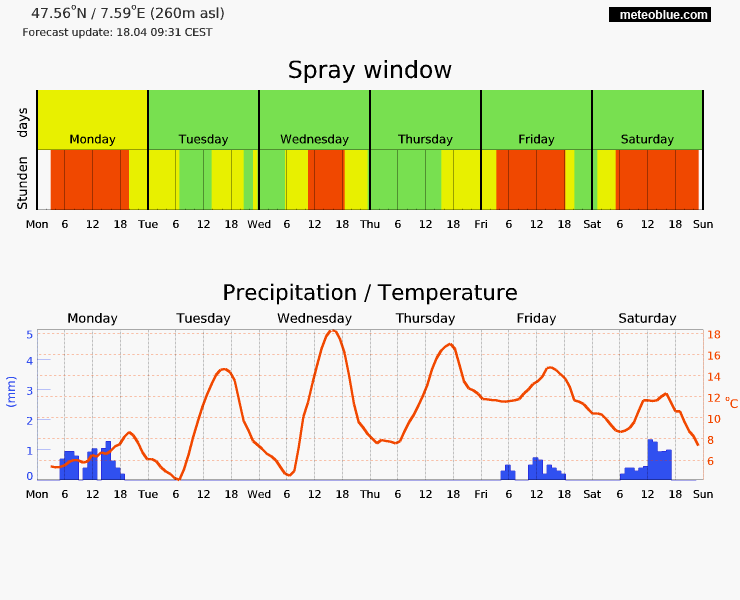
Image API Ready to use Weather and Climate diagrams
meteoblue offers various layers of our weather maps, that can easily be integrated into your farm management system. All maps are available through the meteoblue API and on the meteoblue website. The meteoblue API delivers the maps as graphics in PNG format that have to be implemented on a map (for example GoogleMaps).
For Agricultural risk monitoring we recommend the following layers:
history+
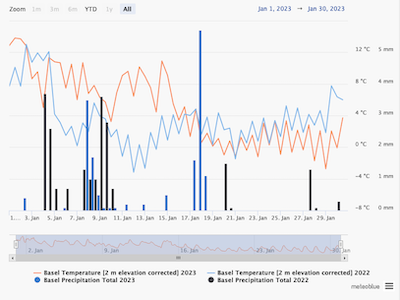
Year comparison
Visualise several seasons with accumulated precipitation or growing degree days (GDD) in one graph. See how a wet or rather hot season may affect plant development, calculate a heating sum to predict how much energy is required during winters or estimate weather conditions for a single week to plan events.
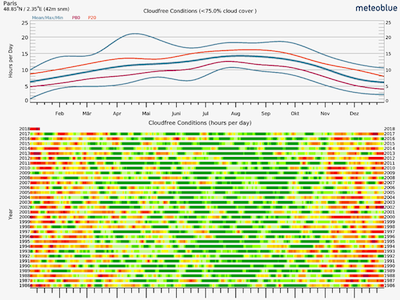
Risk assessment
The risk assessment tool provides an analysis of differentxw events (e.g. frost, drought or heat) over the last 40 years. By comparing different years, you can observe risk levels of specific events over time.
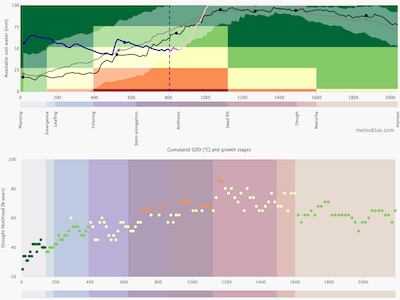
Crop risk
The crop climate risk analysis diagram shows the risks of drought, heat, or frost for a selected crop at a selected location for a chosen period in the time from 1985 to today. Crop risk prediction monitors and evaluates crop risks based on the current season weather to date, the 7-day and the seasonal forecast.
Transmission
How to order?
For pricing examples, detailed information on the access levels, meteoblue credits, support levels and license conditions please consult our API pricing page.
Request a non-binding quote tailored to your requirements.

The form was sent successfully.
Thank you for getting in touch, our experts will contact you within a few business days.
