Maps API

  • Imágenes de satélite y datos de radar en tiempo real con animaciones minuto a minuto, disponibles en todo el mundo
  • Impresionantes visualizaciones de varios modelos meteorológicos, datos de estaciones meteorológicas y animaciones del viento
  • Mapas meteorológicos altamente personalizables con acceso de alta velocidad gracias a la última tecnología y al eficiente procesamiento de datos
  • La visualización de varios niveles de altitud para los mapas de temperatura, viento, nubes y presión permite una sofisticada planificación del vuelo
  • Solución plug-and-play fácil de integrar para su aplicación web o Tile API flexible para soluciones personalizadas

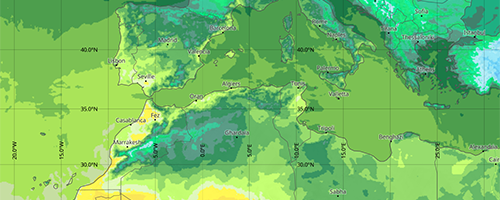
Los mapas meteorológicos de meteoblue ofrecen una amplia gama de variables meteorológicas, fuentes de datos y niveles de altura disponibles en todo el mundo. Las imágenes de satélite en tiempo real, el radar meteorológico y las animaciones de vanguardia proporcionan visualizaciones perfectas. Enriquezca su aplicación web con un plugin fácil de integrar en cuestión de minutos.

Los diseños de los mapas, cuidadosamente elaborados y con la cantidad justa de detalles, garantizan una gran facilidad de uso y un gran atractivo visual tanto para los usuarios ocasionales como para los expertos. La elección de colores, etiquetas, contornos y mapas disponibles se basa en un profundo conocimiento de la cartografía y los datos meteorológicos subyacentes.

Los "Map Tiles" y los estándares abiertos garantizan un alto rendimiento y una gran compatibilidad.
Plugin fácil de integrar

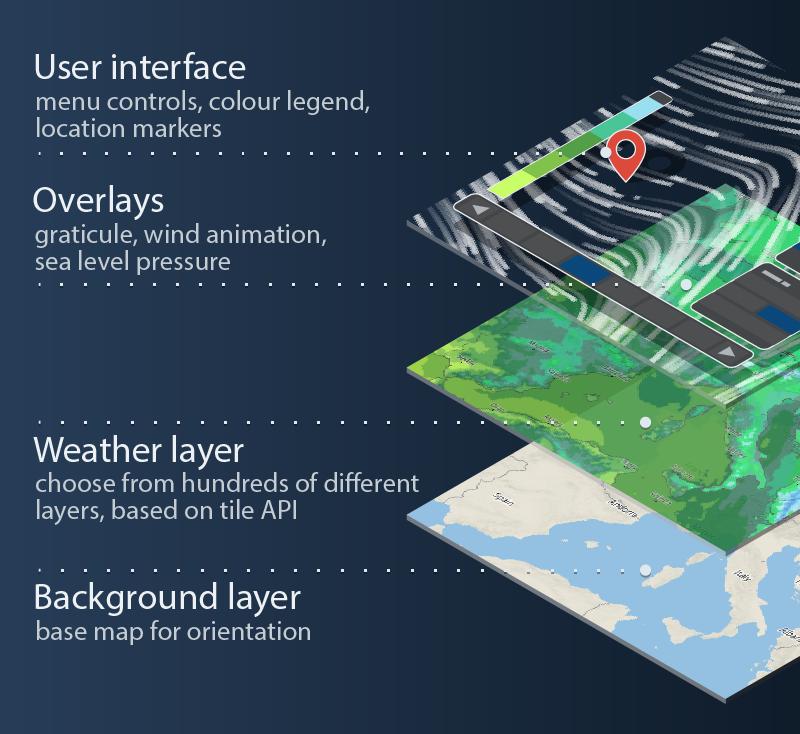
Nuestro plugin fácil de integrar para Mapbox GL JS, que utiliza nuestra map tiles API bajo el capó. Cuenta con una interfaz web lista para usar, similar a la de Weather Maps en meteoblue.com. La animación del viento se ha desarrollado desde cero para ofrecer un rendimiento y un nivel de detalle inigualables. Los mapas de satélite y de radar muestran los datos meteorológicos actuales en una animación fluida minuto a minuto. La animación del radar incluye una previsión de una a dos horas.

Después de simplemente soltar el plugin con una etiqueta de script, añade controles a un mapa existente de Mapbox GL JS para un menú de selección de mapa, selección de tiempo y una leyenda. Elige fácilmente qué mapas deben estar disponibles en la navegación. Personaliza el diseño de la interfaz de usuario para que coincida con el aspecto visual de tu sitio web.

La API de JavaScript proporciona métodos y eventos similares a Mapbox GL JS, para permitir pequeños ajustes hasta reemplazar completamente la interfaz de usuario por defecto. Añade tu propio contenido a través de la potente API de Mapbox GL JS, por ejemplo, marcadores HTML personalizados o ventanas emergentes.

meteoblue Weather Maps

El vídeo que aparece a continuación ofrece una rápida visión general de algunas de las características clave de nuestros Mapas del tiempo, como la animación por satélite, la capa de radar y otras características esenciales de la interfaz de mapas.

Ejemplos

 1
 2
 3
 4
 5
 6
 7
 8
 9
10
11
12
13
14
15
16
17
18
19
20
21
22
23
24
25
26
27
28
29
<script src="https://static.meteoblue.com/cdn/mapbox-gl-js/v1.11.1/mapbox-gl.js"></script>
<link rel="stylesheet" href="https://static.meteoblue.com/cdn/mapbox-gl-js/v1.11.1/mapbox-gl.css" target="_blank" rel="noreferrer">

<script src="https://static.meteoblue.com/lib/maps-plugin/v0.x/maps-plugin.js"></script>

<div id="map_container" style="height: 500px; width: 100%;"></div>

<script>
    const mapboxMap = new mapboxgl.Map({
        container: "map_container",
        center: [7.57327, 47.5584],
        zoom: 5,
        minZoom: 0,
        maxZoom: 24,
        hash: false,
        attributionControl: false,
        keyboard: false,
    });

    const apiKey = "DUMMYAPIKEY";
    const inventoryUrl = "https://maps-api.meteoblue.com/v1/map/inventory/weather-maps?lang=en&apikey=" + apiKey + "&temperatureUnit=CELSIUS&velocityUnit=KILOMETER_PER_HOUR&lengthUnit=metric";

    new meteoblueMapsPlugin({
        mapboxMap: mapboxMap,
        inventory: inventoryUrl,
        apiKey: apiKey,
        canUseRestricted: true,
    });
</script>
 1
 2
 3
 4
 5
 6
 7
 8
 9
10
11
12
13
14
15
16
17
18
19
20
21
22
23
24
25
26
27
28
29
30
31
32
33
34
35
36
37
38
39
40
41
42
43
44
45
46
47
48
49
50
<script src="https://static.meteoblue.com/cdn/mapbox-gl-js/v1.11.1/mapbox-gl.js"></script>
<link rel="stylesheet" href="https://static.meteoblue.com/cdn/mapbox-gl-js/v1.11.1/mapbox-gl.css" target="_blank" rel="noreferrer">

<script src="https://static.meteoblue.com/lib/maps-plugin/v0.x/maps-plugin.js"></script>
                
<style>
    /* Custom Maps Plugin styling is done trough CSS variables */
    .maps-custom-design {
        --meteoblue-mapsplugin-background-primary: rgba(226, 226, 226, 0.692);
        --meteoblue-mapsplugin-background-highlight: rgba(255, 255, 255, 0.746);
        --meteoblue-mapsplugin-background-highlight-secondary: rgba(255, 255, 255, 0.897);
        --meteoblue-mapsplugin-color-primary: rgb(0, 0, 0);
        --meteoblue-mapsplugin-color-progress-bar: rgba(138, 138, 138, 0.883);
        --meteoblue-mapsplugin-color-link-hover: rgb(45, 77, 255);
        --meteoblue-mapsplugin-color-toggle: rgb(90, 90, 90);
        --meteoblue-mapsplugin-border: 1px solid rgb(156, 156, 156);
        --meteoblue-mapsplugin-border-radius: 20px;
        --meteoblue-mapsplugin-text-shadow: 0 0 5px rgb(255, 255, 255);
        --meteoblue-mapsplugin-icon-arrow: url("data:image/svg+xml;charset=utf-8,%3Csvg xmlns='http://www.w3.org/2000/svg' height='10' viewBox='0,0,20,21' width='11'%3E%3Cpath fill='black' d='M0 3l3-3 8 12 7-12 3 3-10 17z'/%3E%3C/svg%3E");
        --meteoblue-mapsplugin-icon-close: url("data:image/svg+xml,%3Csvg xmlns='http://www.w3.org/2000/svg' xmlns:xlink='http://www.w3.org/1999/xlink' width='10' height='10' viewBox='0 0 10 10'%3E%3Cpath fill='black' d='M9.988,8.543 C9.988,8.543 8.543,9.988 8.543,9.988 C8.543,9.988 5.000,6.445 5.000,6.445 C5.000,6.445 1.457,9.988 1.457,9.988 C1.457,9.988 0.012,8.543 0.012,8.543 C0.012,8.543 3.554,5.000 3.554,5.000 C3.554,5.000 0.012,1.457 0.012,1.457 C0.012,1.457 1.457,0.012 1.457,0.012 C1.457,0.012 5.000,3.554 5.000,3.554 C5.000,3.554 8.543,0.012 8.543,0.012 C8.543,0.012 9.988,1.457 9.988,1.457 C9.988,1.457 6.445,5.000 6.445,5.000 C6.445,5.000 9.988,8.543 9.988,8.543 Z' fill-rule='evenodd' /%3E%3C/svg%3E");
        --meteoblue-mapsplugin-icon-play: url("data:image/svg+xml;charset=utf-8,%3Csvg xmlns='http://www.w3.org/2000/svg' height='10' viewBox='0,0,20,21' width='11'%3E%3Cpath fill='black' d='M 0 0 L 20 11 0 21 z'/%3E%3C/svg%3E");
        --meteoblue-mapsplugin-icon-stop: url("data:image/svg+xml;charset=utf-8,%3Csvg xmlns='http://www.w3.org/2000/svg' height='10' viewBox='0,0,20,21' width='11'%3E%3Cpath fill='black' d='M 0 0 L 8 0 8 21 0 21 M 12 0 L 20 0 20 21 12 21 z'/%3E%3C/svg%3E");
        --meteoblue-mapsplugin-icon-menu: url("data:image/svg+xml;charset=utf-8,%3Csvg xmlns='http://www.w3.org/2000/svg' height='10' viewBox='0,0,20,21' width='11'%3E%3Cpath stroke='black' stroke-width='4' d='M 0 2 L 20 2 M 0 10 L 20 10 M 0 18 L 20 18 z'/%3E%3C/svg%3E");
    }
</style>

<div id="map_container" class="maps-custom-design" style="height: 500px; width: 100%;"></div>

<script>
    const mapboxMap = new mapboxgl.Map({
        container: "map_container",
        center: [7.57327, 47.5584],
        zoom: 5,
        minZoom: 0,
        maxZoom: 24,
        hash: false,
        attributionControl: false,
        keyboard: false,
    });

    const apiKey = "DUMMYAPIKEY";
    const inventoryUrl = "https://maps-api.meteoblue.com/v1/map/inventory/filter?lang=en&apikey=" + apiKey + "&maps=satellite,radar,temperature,sunshine,wind,humidity,gph500,apparentTemperature,soilTemperature,precipitationDaily,visibility,airQualityIndex,temperatureAnomaly,uvIndex,obsTemperature,obsPrecipitation&temperatureUnit=CELSIUS&velocityUnit=KILOMETER_PER_HOUR&lengthUnit=metric&overlays=pressure2mOverlay";

    new meteoblueMapsPlugin({
        mapboxMap: mapboxMap,
        inventory: inventoryUrl,
        apiKey: apiKey,
        canUseRestricted: true,
    });
</script>
  1
  2
  3
  4
  5
  6
  7
  8
  9
 10
 11
 12
 13
 14
 15
 16
 17
 18
 19
 20
 21
 22
 23
 24
 25
 26
 27
 28
 29
 30
 31
 32
 33
 34
 35
 36
 37
 38
 39
 40
 41
 42
 43
 44
 45
 46
 47
 48
 49
 50
 51
 52
 53
 54
 55
 56
 57
 58
 59
 60
 61
 62
 63
 64
 65
 66
 67
 68
 69
 70
 71
 72
 73
 74
 75
 76
 77
 78
 79
 80
 81
 82
 83
 84
 85
 86
 87
 88
 89
 90
 91
 92
 93
 94
 95
 96
 97
 98
 99
100
101
102
103
104
105
106
107
108
109
110
111
112
113
114
115
116
117
118
119
120
121
122
123
124
125
126
127
128
129
130
131
132
133
134
135
136
137
138
139
140
141
142
143
144
145
146
147
148
149
150
151
152
153
154
<script src="https://static.meteoblue.com/cdn/mapbox-gl-js/v1.11.1/mapbox-gl.js"></script>
<link rel="stylesheet" href="https://static.meteoblue.com/cdn/mapbox-gl-js/v1.11.1/mapbox-gl.css" target="_blank" rel="noreferrer">

<script src="https://static.meteoblue.com/lib/maps-plugin/v0.x/maps-plugin.js"></script>

<style>
    .custom-menu {
        margin: 0 auto;
        display: flex;
        flex-direction: column;
        justify-content: end;
        position: absolute;
        top: 0;
        right: 0;
        bottom: 0;
        left: 0;
        align-items: center;
        font-size: 1.5em;
    }

    .map-selection, .time-selection {
        pointer-events: initial;
        background: rgba(226, 226, 226, 0.692);
        display: flex;
        border-radius: 5px;
        overflow: hidden;
        width: max-content;
        align-content: center;
        border: 1px solid rgb(109, 109, 109);
    }

    .map-selection .active {
        background: rgb(250, 250, 250);
    }

    .time-selection {
        padding: 0.25em;
        margin-top: 0.5em;
    }

    .map-selection div, .time-selection button {
        cursor: pointer;
        padding: 0.5em;
    }

    .date-display {
        display: flex;
        align-items: center;
        padding: 0 0.5em;
    }
</style>

<div id="map_container" style="height: 500px; width: 100%;"></div>

<script>
    const inventoryUrl = "https://maps-api.meteoblue.com/v1/map/inventory/filter?lang=en&apikey=" + apiKey + "&maps=temperature,sunshine&temperatureUnit=CELSIUS&velocityUnit=KILOMETER_PER_HOUR&lengthUnit=metric&overlays=pressure2mOverlay,graticuleOverlay";
    const apiKey = "DUMMYAPIKEY";

    // Map Selection

    const mapSelection = document.createElement('div');
    mapSelection.classList.add('map-selection');
    
    const temperature = document.createElement('div');
    temperature.innerText = 'Temperature';
    temperature.id = 'temperature';
    temperature.classList.add('active')
    mapSelection.appendChild(temperature);

    const sunshine = document.createElement('div');
    sunshine.innerText = 'Sunshine';
    sunshine.id = 'sunshine';
    mapSelection.appendChild(sunshine);


    // Time Selection

    const customMenu = document.createElement('div');
    customMenu.classList.add('custom-menu');

    const prevButton = document.createElement('button');
    prevButton.disabled = true;
    prevButton.innerText = 'Previous';

    const nextButton = document.createElement('button');
    nextButton.innerText = 'Next';

    const dateDisplay = document.createElement('div');
    dateDisplay.classList.add('date-display');

    const timeSelection = document.createElement('div');
    timeSelection.classList.add('time-selection');
    timeSelection.appendChild(prevButton);
    timeSelection.appendChild(dateDisplay);
    timeSelection.appendChild(nextButton);

    const mapboxMap = new mapboxgl.Map({
        container: "map_container",
        center: [7.57327, 47.5584],
        zoom: 5,
        minZoom: 0,
        maxZoom: 24,
        hash: false,
        attributionControl: false,
        keyboard: false,
    });

    const mapsPlugin = new meteoblueMapsPlugin({
        mapboxMap: mapboxMap,
        inventory: inventoryUrl,
        apiKey: apiKey,
        canUseRestricted: true,
        showSidebar: false,
        showTimeSelection: false,
        content: {
            main: customMenu,
        }
    });

    function changeMap(event) {
        Array.from(mapSelection.children)
            .forEach(child => child.classList.remove('active'));
        event.target.classList.add('active');

        mapsPlugin.setMap({map: event.target.id});
    }

    function changeDateBy(numSteps) {
        const timeSteps = mapsPlugin.getTimeInfo().categories;
        const current = mapsPlugin.getDate();
        const currentIndex = timeSteps.findIndex(category => category === current);

        const maxIndex = timeSteps.length - 1;
        const newIndex = Math.min(Math.max(currentIndex + numSteps, 0), maxIndex);
        const newDate = timeSteps[newIndex].value;

        prevButton.disabled = newIndex === 0;
        nextButton.disabled = newIndex === maxIndex;

        dateDisplay.innerText = newDate;
        mapsPlugin.setDate(newDate);
    }
    
    mapsPlugin.on('load', () => {
        mapSelection.addEventListener('click', changeMap)

        dateDisplay.innerText = mapsPlugin.getDate().value;
        prevButton.addEventListener('click', () => changeDateBy(-1));
        nextButton.addEventListener('click', () => changeDateBy(+1));

        customMenu.appendChild(mapSelection);
        customMenu.appendChild(timeSelection);
    })
</script>

Tile API flexible

Utilice la Tile API subyacente de bajo nivel para obtener soluciones totalmente personalizadas. Proporciona formatos de tile vectoriales y rasterizados estándar, compatibles con todas las bibliotecas de mapeo comunes como Mapbox GL JS, Leaflet, OpenLayers y otras.

La API soporta más de 80 variables meteorológicas diferentes, múltiples modelos meteorológicos y diferentes niveles de altura, pasos de tiempo individuales y agregaciones, pasos de contorno totalmente personalizables (por ejemplo, pasos de temperatura de 2 °C o 4 °C) y colores de mapa personalizables, así como múltiples unidades de medida.

La API de Mapas de meteoblue requiere al menos el nivel de acceso "Access Silver". Descubra más sobre los precios de la API de Mapas en la página web Página de precios API. Si está buscando una solución gratuita para la implementación de mapas en su sitio web, por favor considere nuestro gratuito Widget Mapas Meteo.

Encontrará más información técnica en nuestra documentación técnica para el Maps Plugin, el Tile API y el Maps API Configurator.

  
×

Commercial request

meteoblue offers a wide range of products and solutions for commercial use in many different sectors and industries.

Please fill out the fields below in order to send us your request. Our experts will reply within a few business days.

The form was sent successfully.

Thank you for getting in touch, our experts will contact you within a few business days.