High/Low pressure
High and Low pressure areas

Low/High pressure
Source: Physik, Uni - München
Low pressure areas (depression)
Because of the insolation, the Earth's surface is warming up and acts like a heating to the surrounding air. The air expands while heating and, because of the expansion, has a lower concentration than the cold air. As a consequense of this, the warm air raises up and warms also the regions above. Simultaneously, the air takes off from the "heating" - the ground - and is thus cooling down. If this process occurs in a greater area, there will arise a great packet, warmer, expanded air, which is now more stratified (towering) than the surrounding air. If this height difference grows, the warmer air starts to flow laterally over the adjoining cooler air packets. Because of this, the air is cooling down further, getting heavier and finally sinking to the ground when it hits the less cool regions.
Based on this process, a circulation arises. The air raises up under high pressure, is
spreading out laterally and is flowing down to the areas with lower pressure.The remaining air is cooling down under
certain conditions and so is decreasing. Because of the drain, it has lost some of its mass and the pressure is thus
sinking.
By warming, the air can also absorb more water. This air is moved up by the increase of water. If the
air is cooling down, humidity will pass out again: clouds are formed in altitude. An evidence for the lateral runoff
of warmer air masses is the construction of cirrostratus clouds, which compress themselves more and more.
Cirrostratus clouds are formed by the continuing flow of more warm and humid air. If the flow of warm air
(advection) goes on, altostratus clouds are builded, followed by nimbostratus clouds. These nimbostratus clouds are
usually connected to enduring drizzel, the so called "steady rain". Because of the rain, the cloud ceiling is
breaking off more and more until that the sun finally reaches the ground and starts to warm up the air again.
Thermic Low: ground low, height low
A thermic low-pressure area developes by a difference in the air pressure which is realised by a warming (insolation) or a cooling. Whether it is a ground low or a height low depends on the concerning air regions.
A ground low developes if the density of the air near to the ground is decreasing while the air is warming up. The warm air is breaking away from ground and rises up (thermic), what leads to a pressure decrease at the ground level (in higher regions the air pressure is rising because of the inflowing warm air coming from the ground). The decrease of the pressure near to the ground leads to a spacious inflow of external air; we thus have wind.
A height low developes if cold air flows down from great heights what reduces the air pressure in the higher regions of the air. On the ground instead the air pressure is increasing. The height low is based on a height of 5 km and is identified thanks to its low temperatures in comparison to its surroundings. On the height weather map (e.g. 500 hPa-topopgraphy) you can see the height low through some closed isohypses (same height line), while on ground weather maps it is nearly not noticeable.
Dynamic low (cyclone)
A dynamic low developes if the air flow converges in lower regions of the atmosphere and diverges in altitude while the air is kept up in the centre of the low.
High pressure areas (anticyclone)
In an anticyclone, air masses drop extensively. At the same time, the air warms itself up, so
that no condensation and consequently no cloud formation can take place. Near to the ground, the air flows out of
the anticyclone in the direction of depression - it diverges. Hence, there is no formation of fronts in altitude.
During the subsidence of the air masses, an inversion forms. That is where the clouds are dissolved.
An
anticyclone is builded quiet slowly. The forces of circulation in the subtropic areas lead to stable anticyclones.
Because of the differences in the origin or development, the anticyclones are divided into three categories:
- A cold anticyclone originates if air cools off, for example, in winter above a cool land mass (e.g., Central Asian high). Then the air has a bigger density and exerts a higher pressure on the base. In the middle latitudes, it can also originate in the form of flat wedges in the back of cyclones as a ridge of high pressure.
- A dynamic anticyclone is generated by the Rossby-waves (Polar front, Jet Stream). The dynamic Azores anticyclone exerts, on this occasion, a big influence on the weather of Central Europe.
- A high anticyclone is an anticyclone which appears at big heights and is thus shown in high weather maps. It is always connected with a ground low-pressure area, because with the warming of the surfaces, the vertical pressure gradient is lowered and reflects itself the relative atmospheric pressure reduction on the ground with increasing height in a pressure relatively higher to the horizontal surroundings. Hence, one can derive the other way around a height low-pressure area also from a ground anticyclone (also thermal anticyclone).
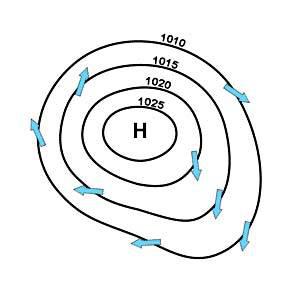
Isobars
If we choose locations on the map which have the same air pressure in a certain perimetre and
if we connect them with a line, there will be a circle. These circles are called isobars.
This process is
repeated again and again with a different air pressure without that the circles touch or cross each other. On
weather maps, an international standard for the gap between the circles is 5 hPa (hPa = unit for the measurement of
the air pressure). The closer the lines of the circles are locatetd parallely, the higher is the pressure gradient.
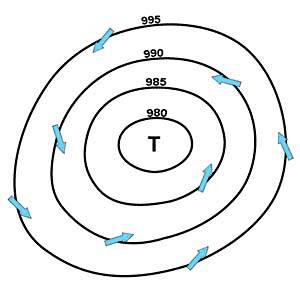
In the heart of a cyclone, the smallest the circle of a low-pressure area, the lowest the pressure. The more you move away from the heart, the higher is the air pressure.
In the high-pressure area, it is the other way around. The highest pressure is in the heart of the anticyclone and the more you move away from it, the more the pressure is sinking.
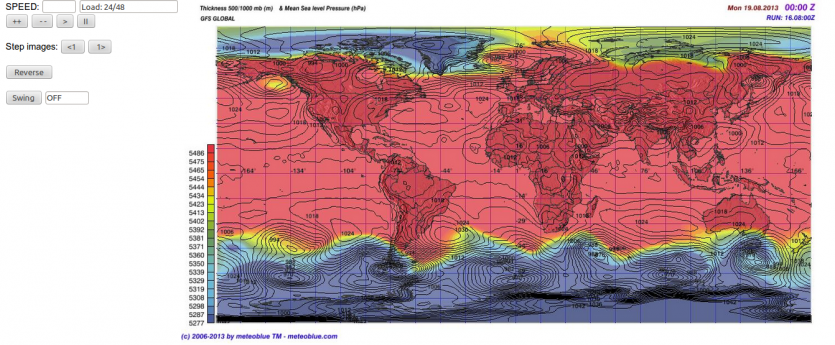
Worldmap for relative barometric pressure / topography
Weather events
By warming, the air can absorb more humidty and can rise up thanks to its lower density and so the humidity is lifted to higher regions. There, the air is cooling down and so losing its water holding capacity. After a rapid rise, the air reaches a great height over a warm area; it has kept more water than it could keep beeing cool. It flows extensively to the sides, while exuding humidity: so, cirrus are formed in great height, which one compress more and more, until cirrostratus clouds are finally built. These clouds are replaced laterally by the further inflowing air. Because of the increase of warm air (advection), altostratus clouds are built, followed by nimbostratus clouds, which are usually connected with steady rain. The cloud ceiling is breaking up more and more because of the rain, until the Sun finally reaches the ground and warms the air.
Questions for training
In the following, you can query and test your knowledge - and apply it. If you are in doubt,
read the text and images above again.
Try it out ;-). We - the meteoblue Team - wish you fun!
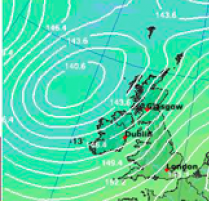
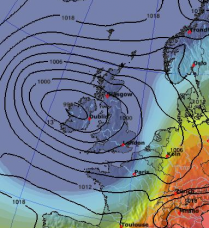
Take a look at the map on the right handsite. It is an extract of a pressure area at 850 mbar (about 1.5 km) height. Can you tell, by reference to the pressure gradient, wether it is a low-pressure area or a high-pressure area?
Follow now how the pressure area is coming closer to Dublin on the animated map. Pay attention
to the pressure map in the higher regions (height at 500 mb, about 5 km). Do you find here the same location of the
pressure area?
These maps are located in Europe - so on the northern hemisphere. Try to understand, by
reference to the animated cloud and precipitation maps, in which direction the wind of the pressure area is blowing
(thanks to this, you can also recognise wether it is a low-pressure area or a high-pressure area).
Attention:
On the southern hemisphere, the winds of the pressure areas blow the other way around.
Animated maps
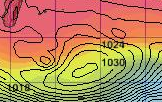
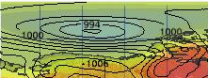
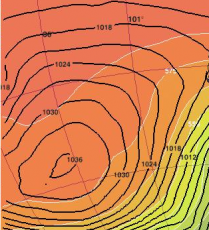
Below you can see 4 different figures. Two of them are high-pressure areas and two are
low-pressure areas. Note which belongs to the low and which to the high pressure.
Tip: Pay attention to the
pressure of the isobars.