Maps API

  • Imagens de satélite e dados de radar em tempo real com animação minuto a minuto, disponíveis globalmente
  • Visualizações impressionantes de vários modelos meteorológicos, dados da estação meteorológica e animações do vento
  • Mapas meteorológicos altamente personalizáveis com acesso de alta velocidade graças à mais recente tecnologia e processamento de dados eficiente
  • Exibição de vários níveis de altitude para mapas de temperatura, vento, nuvens e pressão permite um sofisticado planejamento de vôo
  • Solução plug-and-play fácil de integrar para sua aplicação web ou Tile API flexível para soluções personalizadas

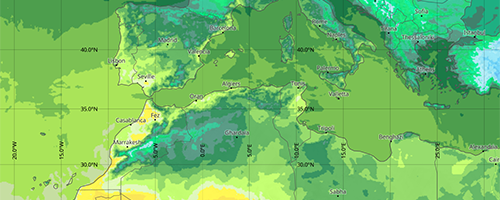
Os mapas meteorológicos meteoblue oferecem uma ampla gama de variáveis meteorológicas disponíveis globalmente, fontes de dados e níveis de altura. Imagens de satélite em tempo real, radares meteorológicos e animações de vanguarda proporcionam visualizações perfeitas. Enriqueça sua aplicação web com um plug-in fácil de integrar em poucos minutos.

Projetos de mapas cuidadosamente elaborados com a quantidade certa de detalhes garantem alta usabilidade e apelo visual para ambos, usuários casuais e especialistas. A escolha de cores, rótulos, contornos e mapas disponíveis é baseada em um profundo entendimento da cartografia e dos dados meteorológicos subjacentes.

Os Tiles do mapa e os padrões abertos garantem alto desempenho e grande compatibilidade.

Plug-in de fácil integração

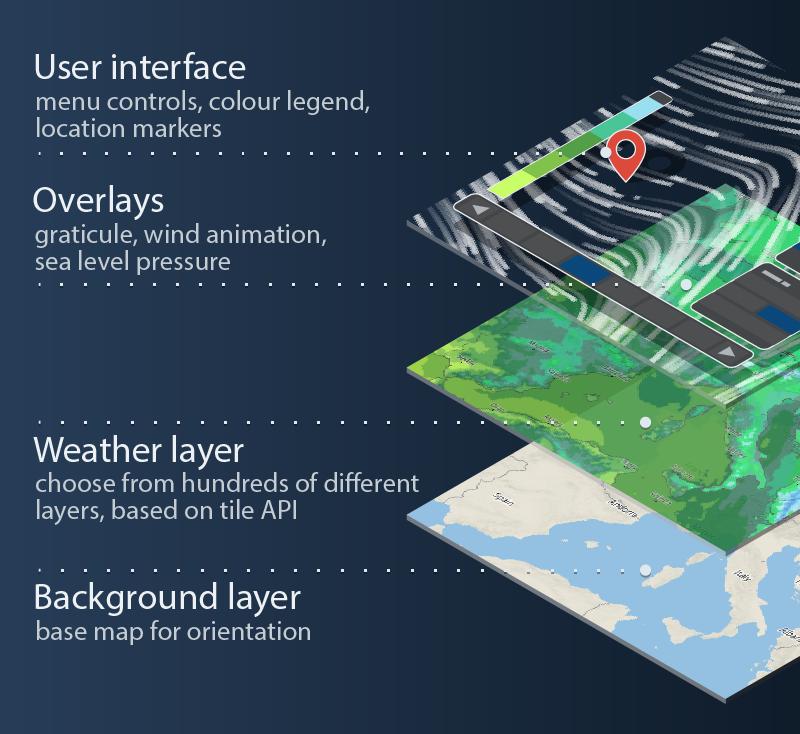
Nosso plugin fácil de integrar para Mapbox GL JS, que utiliza nosso Map Tiles API por baixo. Ele apresenta uma interface web pronta para uso, semelhante à do Weather Maps em meteoblue.com. A animação pelo vento foi desenvolvida desde o início para proporcionar um desempenho e níveis de detalhe inigualáveis. Os mapas de satélite e radar mostram os dados meteorológicos atuais como uma animação contínua minuto a minuto. A animação por radar inclui uma previsão para uma a duas horas à frente.

Depois de simplesmente deixar cair no plugin com uma etiqueta de script, ele adiciona controles a um mapa GL JS da Mapbox existente para um menu de seleção de mapas, seleção do tempo e uma legenda. Escolha facilmente quais mapas devem estar disponíveis na navegação. Personalize o design da IU para combinar com a aparência visual de seu site.

O JavaScript API fornece métodos e eventos similares ao Mapbox GL JS, para permitir pequenos ajustes para substituir completamente a interface padrão do usuário. Adicione seu próprio conteúdo através do poderoso Mapbox GL JS API, por exemplo, marcadores HTML personalizados ou pop-ups.

meteoblue Weather Maps

O vídeo abaixo fornece uma visão geral rápida de alguns dos principais recursos de nossos mapas meteorológicos, como a animação de satélite, a camada de radar e outros recursos essenciais da interface do mapa.

Exemplos

 1
 2
 3
 4
 5
 6
 7
 8
 9
10
11
12
13
14
15
16
17
18
19
20
21
22
23
24
25
26
27
28
29
<script src="https://static.meteoblue.com/cdn/mapbox-gl-js/v1.11.1/mapbox-gl.js"></script>
<link rel="stylesheet" href="https://static.meteoblue.com/cdn/mapbox-gl-js/v1.11.1/mapbox-gl.css" target="_blank" rel="noreferrer">

<script src="https://static.meteoblue.com/lib/maps-plugin/v0.x/maps-plugin.js"></script>

<div id="map_container" style="height: 500px; width: 100%;"></div>

<script>
    const mapboxMap = new mapboxgl.Map({
        container: "map_container",
        center: [7.57327, 47.5584],
        zoom: 5,
        minZoom: 0,
        maxZoom: 24,
        hash: false,
        attributionControl: false,
        keyboard: false,
    });

    const apiKey = "DUMMYAPIKEY";
    const inventoryUrl = "https://maps-api.meteoblue.com/v1/map/inventory/weather-maps?lang=en&apikey=" + apiKey + "&temperatureUnit=CELSIUS&velocityUnit=KILOMETER_PER_HOUR&lengthUnit=metric";

    new meteoblueMapsPlugin({
        mapboxMap: mapboxMap,
        inventory: inventoryUrl,
        apiKey: apiKey,
        canUseRestricted: true,
    });
</script>
 1
 2
 3
 4
 5
 6
 7
 8
 9
10
11
12
13
14
15
16
17
18
19
20
21
22
23
24
25
26
27
28
29
30
31
32
33
34
35
36
37
38
39
40
41
42
43
44
45
46
47
48
49
50
<script src="https://static.meteoblue.com/cdn/mapbox-gl-js/v1.11.1/mapbox-gl.js"></script>
<link rel="stylesheet" href="https://static.meteoblue.com/cdn/mapbox-gl-js/v1.11.1/mapbox-gl.css" target="_blank" rel="noreferrer">

<script src="https://static.meteoblue.com/lib/maps-plugin/v0.x/maps-plugin.js"></script>
                
<style>
    /* Custom Maps Plugin styling is done trough CSS variables */
    .maps-custom-design {
        --meteoblue-mapsplugin-background-primary: rgba(226, 226, 226, 0.692);
        --meteoblue-mapsplugin-background-highlight: rgba(255, 255, 255, 0.746);
        --meteoblue-mapsplugin-background-highlight-secondary: rgba(255, 255, 255, 0.897);
        --meteoblue-mapsplugin-color-primary: rgb(0, 0, 0);
        --meteoblue-mapsplugin-color-progress-bar: rgba(138, 138, 138, 0.883);
        --meteoblue-mapsplugin-color-link-hover: rgb(45, 77, 255);
        --meteoblue-mapsplugin-color-toggle: rgb(90, 90, 90);
        --meteoblue-mapsplugin-border: 1px solid rgb(156, 156, 156);
        --meteoblue-mapsplugin-border-radius: 20px;
        --meteoblue-mapsplugin-text-shadow: 0 0 5px rgb(255, 255, 255);
        --meteoblue-mapsplugin-icon-arrow: url("data:image/svg+xml;charset=utf-8,%3Csvg xmlns='http://www.w3.org/2000/svg' height='10' viewBox='0,0,20,21' width='11'%3E%3Cpath fill='black' d='M0 3l3-3 8 12 7-12 3 3-10 17z'/%3E%3C/svg%3E");
        --meteoblue-mapsplugin-icon-close: url("data:image/svg+xml,%3Csvg xmlns='http://www.w3.org/2000/svg' xmlns:xlink='http://www.w3.org/1999/xlink' width='10' height='10' viewBox='0 0 10 10'%3E%3Cpath fill='black' d='M9.988,8.543 C9.988,8.543 8.543,9.988 8.543,9.988 C8.543,9.988 5.000,6.445 5.000,6.445 C5.000,6.445 1.457,9.988 1.457,9.988 C1.457,9.988 0.012,8.543 0.012,8.543 C0.012,8.543 3.554,5.000 3.554,5.000 C3.554,5.000 0.012,1.457 0.012,1.457 C0.012,1.457 1.457,0.012 1.457,0.012 C1.457,0.012 5.000,3.554 5.000,3.554 C5.000,3.554 8.543,0.012 8.543,0.012 C8.543,0.012 9.988,1.457 9.988,1.457 C9.988,1.457 6.445,5.000 6.445,5.000 C6.445,5.000 9.988,8.543 9.988,8.543 Z' fill-rule='evenodd' /%3E%3C/svg%3E");
        --meteoblue-mapsplugin-icon-play: url("data:image/svg+xml;charset=utf-8,%3Csvg xmlns='http://www.w3.org/2000/svg' height='10' viewBox='0,0,20,21' width='11'%3E%3Cpath fill='black' d='M 0 0 L 20 11 0 21 z'/%3E%3C/svg%3E");
        --meteoblue-mapsplugin-icon-stop: url("data:image/svg+xml;charset=utf-8,%3Csvg xmlns='http://www.w3.org/2000/svg' height='10' viewBox='0,0,20,21' width='11'%3E%3Cpath fill='black' d='M 0 0 L 8 0 8 21 0 21 M 12 0 L 20 0 20 21 12 21 z'/%3E%3C/svg%3E");
        --meteoblue-mapsplugin-icon-menu: url("data:image/svg+xml;charset=utf-8,%3Csvg xmlns='http://www.w3.org/2000/svg' height='10' viewBox='0,0,20,21' width='11'%3E%3Cpath stroke='black' stroke-width='4' d='M 0 2 L 20 2 M 0 10 L 20 10 M 0 18 L 20 18 z'/%3E%3C/svg%3E");
    }
</style>

<div id="map_container" class="maps-custom-design" style="height: 500px; width: 100%;"></div>

<script>
    const mapboxMap = new mapboxgl.Map({
        container: "map_container",
        center: [7.57327, 47.5584],
        zoom: 5,
        minZoom: 0,
        maxZoom: 24,
        hash: false,
        attributionControl: false,
        keyboard: false,
    });

    const apiKey = "DUMMYAPIKEY";
    const inventoryUrl = "https://maps-api.meteoblue.com/v1/map/inventory/filter?lang=en&apikey=" + apiKey + "&maps=satellite,radar,temperature,sunshine,wind,humidity,gph500,apparentTemperature,soilTemperature,precipitationDaily,visibility,airQualityIndex,temperatureAnomaly,uvIndex,obsTemperature,obsPrecipitation&temperatureUnit=CELSIUS&velocityUnit=KILOMETER_PER_HOUR&lengthUnit=metric&overlays=pressure2mOverlay";

    new meteoblueMapsPlugin({
        mapboxMap: mapboxMap,
        inventory: inventoryUrl,
        apiKey: apiKey,
        canUseRestricted: true,
    });
</script>
  1
  2
  3
  4
  5
  6
  7
  8
  9
 10
 11
 12
 13
 14
 15
 16
 17
 18
 19
 20
 21
 22
 23
 24
 25
 26
 27
 28
 29
 30
 31
 32
 33
 34
 35
 36
 37
 38
 39
 40
 41
 42
 43
 44
 45
 46
 47
 48
 49
 50
 51
 52
 53
 54
 55
 56
 57
 58
 59
 60
 61
 62
 63
 64
 65
 66
 67
 68
 69
 70
 71
 72
 73
 74
 75
 76
 77
 78
 79
 80
 81
 82
 83
 84
 85
 86
 87
 88
 89
 90
 91
 92
 93
 94
 95
 96
 97
 98
 99
100
101
102
103
104
105
106
107
108
109
110
111
112
113
114
115
116
117
118
119
120
121
122
123
124
125
126
127
128
129
130
131
132
133
134
135
136
137
138
139
140
141
142
143
144
145
146
147
148
149
150
151
152
153
154
<script src="https://static.meteoblue.com/cdn/mapbox-gl-js/v1.11.1/mapbox-gl.js"></script>
<link rel="stylesheet" href="https://static.meteoblue.com/cdn/mapbox-gl-js/v1.11.1/mapbox-gl.css" target="_blank" rel="noreferrer">

<script src="https://static.meteoblue.com/lib/maps-plugin/v0.x/maps-plugin.js"></script>

<style>
    .custom-menu {
        margin: 0 auto;
        display: flex;
        flex-direction: column;
        justify-content: end;
        position: absolute;
        top: 0;
        right: 0;
        bottom: 0;
        left: 0;
        align-items: center;
        font-size: 1.5em;
    }

    .map-selection, .time-selection {
        pointer-events: initial;
        background: rgba(226, 226, 226, 0.692);
        display: flex;
        border-radius: 5px;
        overflow: hidden;
        width: max-content;
        align-content: center;
        border: 1px solid rgb(109, 109, 109);
    }

    .map-selection .active {
        background: rgb(250, 250, 250);
    }

    .time-selection {
        padding: 0.25em;
        margin-top: 0.5em;
    }

    .map-selection div, .time-selection button {
        cursor: pointer;
        padding: 0.5em;
    }

    .date-display {
        display: flex;
        align-items: center;
        padding: 0 0.5em;
    }
</style>

<div id="map_container" style="height: 500px; width: 100%;"></div>

<script>
    const inventoryUrl = "https://maps-api.meteoblue.com/v1/map/inventory/filter?lang=en&apikey=" + apiKey + "&maps=temperature,sunshine&temperatureUnit=CELSIUS&velocityUnit=KILOMETER_PER_HOUR&lengthUnit=metric&overlays=pressure2mOverlay,graticuleOverlay";
    const apiKey = "DUMMYAPIKEY";

    // Map Selection

    const mapSelection = document.createElement('div');
    mapSelection.classList.add('map-selection');
    
    const temperature = document.createElement('div');
    temperature.innerText = 'Temperature';
    temperature.id = 'temperature';
    temperature.classList.add('active')
    mapSelection.appendChild(temperature);

    const sunshine = document.createElement('div');
    sunshine.innerText = 'Sunshine';
    sunshine.id = 'sunshine';
    mapSelection.appendChild(sunshine);


    // Time Selection

    const customMenu = document.createElement('div');
    customMenu.classList.add('custom-menu');

    const prevButton = document.createElement('button');
    prevButton.disabled = true;
    prevButton.innerText = 'Previous';

    const nextButton = document.createElement('button');
    nextButton.innerText = 'Next';

    const dateDisplay = document.createElement('div');
    dateDisplay.classList.add('date-display');

    const timeSelection = document.createElement('div');
    timeSelection.classList.add('time-selection');
    timeSelection.appendChild(prevButton);
    timeSelection.appendChild(dateDisplay);
    timeSelection.appendChild(nextButton);

    const mapboxMap = new mapboxgl.Map({
        container: "map_container",
        center: [7.57327, 47.5584],
        zoom: 5,
        minZoom: 0,
        maxZoom: 24,
        hash: false,
        attributionControl: false,
        keyboard: false,
    });

    const mapsPlugin = new meteoblueMapsPlugin({
        mapboxMap: mapboxMap,
        inventory: inventoryUrl,
        apiKey: apiKey,
        canUseRestricted: true,
        showSidebar: false,
        showTimeSelection: false,
        content: {
            main: customMenu,
        }
    });

    function changeMap(event) {
        Array.from(mapSelection.children)
            .forEach(child => child.classList.remove('active'));
        event.target.classList.add('active');

        mapsPlugin.setMap({map: event.target.id});
    }

    function changeDateBy(numSteps) {
        const timeSteps = mapsPlugin.getTimeInfo().categories;
        const current = mapsPlugin.getDate();
        const currentIndex = timeSteps.findIndex(category => category === current);

        const maxIndex = timeSteps.length - 1;
        const newIndex = Math.min(Math.max(currentIndex + numSteps, 0), maxIndex);
        const newDate = timeSteps[newIndex].value;

        prevButton.disabled = newIndex === 0;
        nextButton.disabled = newIndex === maxIndex;

        dateDisplay.innerText = newDate;
        mapsPlugin.setDate(newDate);
    }
    
    mapsPlugin.on('load', () => {
        mapSelection.addEventListener('click', changeMap)

        dateDisplay.innerText = mapsPlugin.getDate().value;
        prevButton.addEventListener('click', () => changeDateBy(-1));
        nextButton.addEventListener('click', () => changeDateBy(+1));

        customMenu.appendChild(mapSelection);
        customMenu.appendChild(timeSelection);
    })
</script>

Tile API Flexível

Utilize o API de baixo nível subjacente para soluções totalmente personalizadas. Ele fornece formatos vetoriais e raster tile padrão, compatíveis com todas as bibliotecas de mapeamento comuns, como Mapbox GL JS, Leaflet, OpenLayers e outros.

O API suporta 80+ variáveis meteorológicas diferentes, vários modelos meteorológicos e diferentes níveis de altura, etapas e agregados de tempo único, etapas de contorno totalmente personalizáveis (por exemplo, etapas de temperatura de 2 °C ou 4 °C) e cores de mapa personalizáveis, assim como múltiplas unidades de medida.

O Maps API de meteoblue requer pelo menos o nível de acesso "Access Silver". Saiba mais sobre os preços do Maps API na Página de preços API. Se você está procurando uma solução gratuita para implementar mapas em seu site, por favor, considere nosso gratuito Widget Mapas Meteo.

Encontre mais informações técnicas em nossa documentação técnica para o Maps Plugin, o Tile API e o Maps API Configurator.

  
×

Commercial request

meteoblue offers a wide range of products and solutions for commercial use in many different sectors and industries.

Please fill out the fields below in order to send us your request. Our experts will reply within a few business days.

The form was sent successfully.

Thank you for getting in touch, our experts will contact you within a few business days.