
Image API
- Worldwide access to attractive visualisations of climate and weather data in verified meteoblue quality
- Condensed display for specific use cases such as agriculture, aviation, outdoor & sports and many more
- Large variety of meteograms, multimodel displays, seasonal forecasts, cross-sections, risk assessments and other visualisations
- Easy assessment of climate change and risk with comprehensive diagrams
- All displays are customizable and constantly updated with current weather information
The Image API provides comprehensive visualisations for complex use cases and is available for every point on
Earth.
Specific displays of climate diagrams and climate change scenarios are available as well as forecast
meteograms tailored to the particular needs of the user.
We would be pleased to support you with a free API trial access upon request.
Christoph Ramshorn
Chief Cooperation(s) Officer
meteoblue AG
Forecast Images
The following images display the meteoblue weather forecasts. You can select from a wide range of meteograms,
multimodel forecasts, pictoprints and professional air diagrams. All Forecast Images are available through the
meteoblue Image API.
General Meteograms
The following meteograms display forecast images for general purposes.
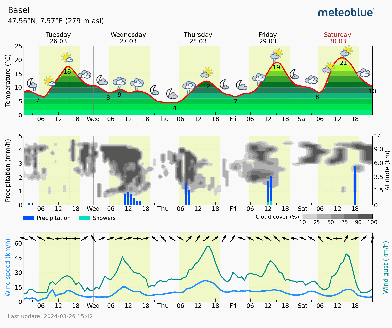
Meteogram 5-days
The Meteogram 5-days shows a forecast for 5 days in 3 different diagrams (temperature, precipitation & clouds
and wind charts) for the selected location.
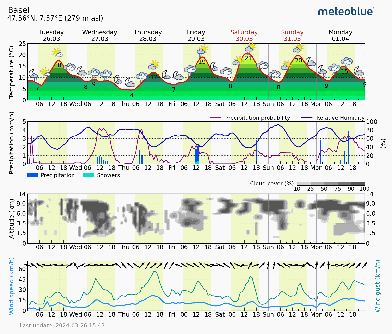
Meteogram 7-days
The meteogram 7-days shows a forecast for 7 days in 4 different diagrams (temperature, precipitation, clouds and
wind charts) for the selected location.
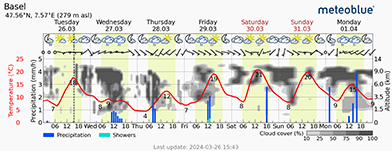
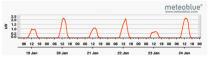
Meteogram All-in-One
The meteogram All-in-One shows the weather forecast for the next 6 days in one simple diagram featuring weather
pictograms, a temperature curve, precipitation amount and type, cloud development and wind speed and direction
in hourly time steps for the selected location.
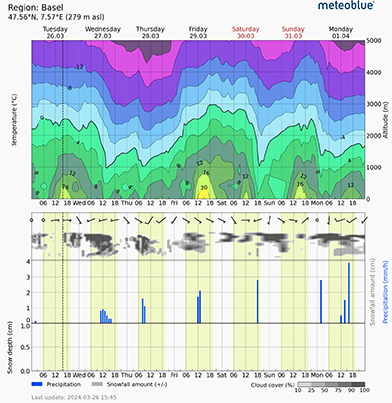
Meteogram Snow
The Meteogram Snow shows the development of temperature at various altitudes, precipitation (blue for rain
and light grey for snow), snow melt and snow height (third diagram), corresponding to a grid cell of the selected
model, without local adaptations to a specific location.
Agronomical Meteograms
The following meteograms display the weather forecasts for
agronomical purposes. They display a wide range of agronomical variables
and support weather dependent decisions such as suitable times for sowing, spraying and harvesting.
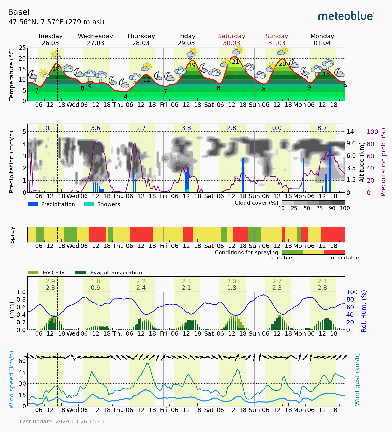
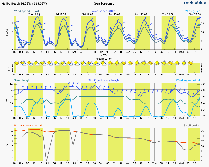
Meteogram Agro
The Meteogram Agro shows the development of the weather with diagrams of air temperature, wind velocity and
direction on the ground, as well as precipitation, clouds, spraying windows and evaporation, corresponding to a grid
cell of the selected model, without adaptations to a specific location.
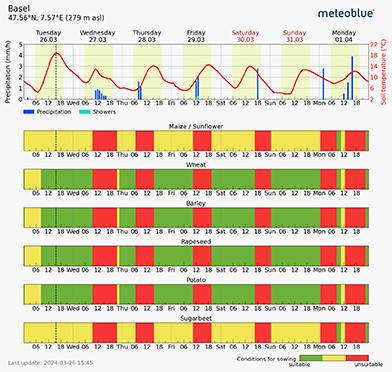
Meteogram Agro Sowing
The Meteogram Agro Sowing shows the development of the soil temperature and precipitation up to 7 days ahead.
Additionally it includes sowing windows for maize, wheat, barley, rapeseed, potato and sugar beets. The
sowing window is separated into three categories: suitable (green), less suitable (yellow) and unsuitable (red)
periods for application in hourly intervals.
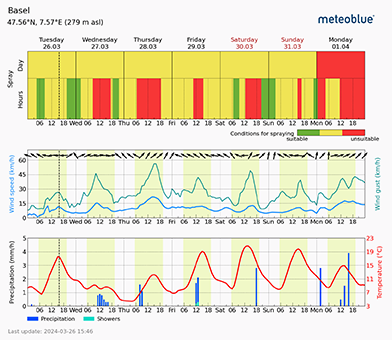
Meteogram Agro Spraying
The Meteogram Agro Spraying shows the development of the temperature and precipitation for up to 7 days.
Additionally it includes the spraying window. The spraying window helps identifying suitable periods for applying crop
protection measures, by showing suitable (green), less suitable (yellow) and unsuitable (red) periods for application.
The conditions are calculated from wind, precipitation, temperature and humidity.
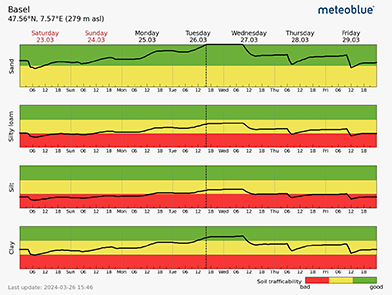
Meteogram Soil Trafficability
The meteogram Agro Trafficability shows the capacity of the soil to support moving vehicles based on the
development of water content in the topsoil (0-10cm). The development of Soil Trafficability is represented in a line
graph (black) that moves though 3 trafficability conditions, good trafficability (green), restricted
trafficability (yellow) and no trafficability (red).
The soil trafficability development is calculated for four types of soil: Sand, Silty Loam, Silt and Clay,
each of which has a different water holding capacity and reacts differently to weather conditions.
The calculation uses information of precipitation amount, sunshine hours, soil-specific water holding
capacity and more.
Aviational Meteograms
The following meteograms display the weather forecasts for aviational purposes. They provide
information about the atmosphere, such as temperature, clouds and wind at different heights.
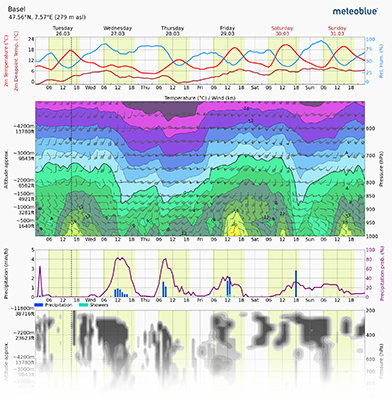
Meteogram Air
The meteogram Air shows the weather development in the atmosphere, from ground to around 5500 meters
elevation (pressure levels 1020 to 500 hPa respectively) simulating the air layers above the selected location. The forecasts are
shown for 3 to 6 days ahead.
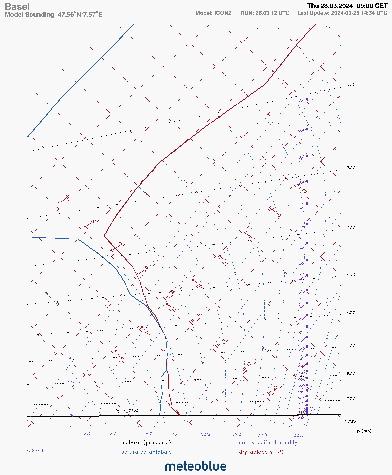
Meteogram Sounding
The meteogram Sounding shows the weather development in the atmosphere, from the ground to the stratosphere
(pressure levels 1013 to 100 hPa), simulating the measurements of a sounding balloon.
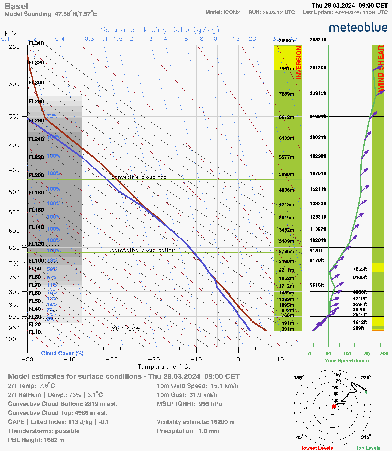
Meteogram Stueve
The meteogram Stueve allows you to know a lot about the air conditions within only one diagram.
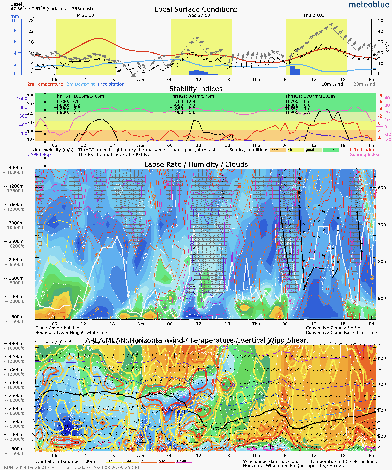
Meteogram Thermal Forecast
The meteogram Thermal Forecast contains atmospheric data for forecasting flight conditions for paragliding,
soaring and ballooning.
It includes detailed information about surface conditions, stability indices, lapse rate, humidity,
clouds and wind. The forecasts are shown for the next 3 days.
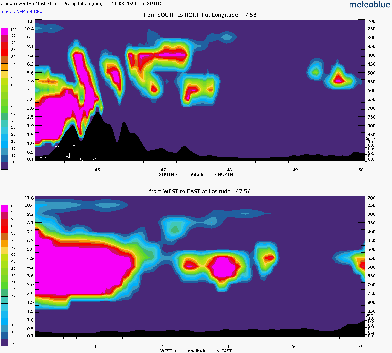
Cross-Sections
The meteoblue Cross-Sections show a vertical cut through the atmosphere. The standard cross-sections have two
directions: North-South and West-East.
The selected place is in the centre of the display (black line). The cross-sections can be customised setting
the distance from the center (in "degree"), together with the time of the forecast.
In addition to the default version, the following cross-section variants are available for specific use cases:
- Cross-Section Clouds
- Cross-Section Temperature
- Cross-Section Wind
- Cross-Section Relative Humidity
- Path Cross-Sections
MultiModel and Ensemble Meteograms
The following meteograms display the weather forecasts calculated by different models or
ensemble members
of the GFS ensemble forecast.
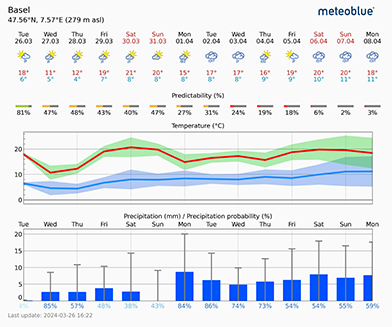
Meteogram 14-Days
The meteogram 14-Days shows the weather forecast for the next 14 days, with weather pictograms, a
range of maximum, average and minimum temperatures and precipitation amounts,
as well as the precipitation probability for each day.
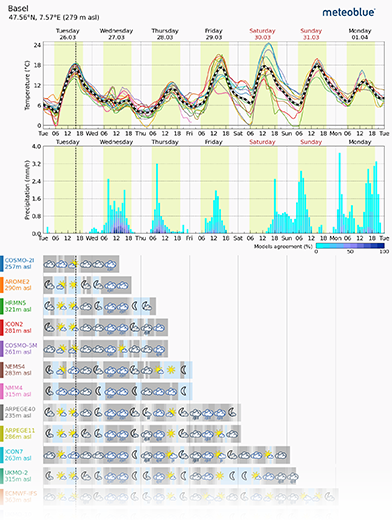
Meteogram MultiModel
The meteogram MultiModel shows and compares forecasts of various models from meteoblue as well as
third party
operators, corresponding to a grid cell of the selected model, without local adaptations to a
specific location.
The
purpose of the MultiModel is not to make local predictions for the selected place, but to show the
possible
divergence of the evolutions of the weather, through the presentation of different models.
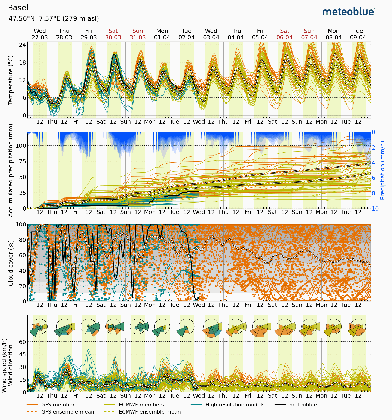
Meteogram MultiModel Ensemble
The meteogram MultiModel Ensemble shows diagrams for temperature, accumulated precipitation, cloud
cover and wind
speed and direction. The diagrams display different model data individually, as well as an ensemble
mean,
differentiating the meteoblue models and high resolution models.
More Meteograms
The following meteograms display the meteoblue weather forecasts focused on specific variables
and
purposes.
Meteogram Solar Forecast
The meteogram Solar Forecast shows the expected solar power production for the next 6 days. The
solar power plant
can
be specified with setting kWp, slope and orientation.
Meteogram Sea
The meteogram Sea shows marine weather forecasts for locations at sea. It shows detailed
information about wind
speed
and direction, precipitation, wave and swell heights and periods.
Long Term Meteograms
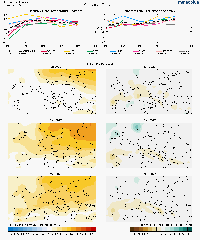
Meteogram Seasonal Anomalies Forecast
The meteogram Seasonal Anomalies Forecast contains all relevant information for trend
forecasts of seasonal
anomalies for the next 6 months. It displays monthly seasonal forecast anomalies from
different models as well
as a
super-ensemble (SA-ENSEMBLE) created by meteoblue, which is a mean based on over 300
individual forecasts from
different forecast centers and is more likely to be true than any single model.
History & Climate Images
The following images display the meteoblue Historical & Climate Images. They include the weather
archive, risk
assessments and various other historical meteograms. All History & Climate Images are
available through the
meteoblue Image API.
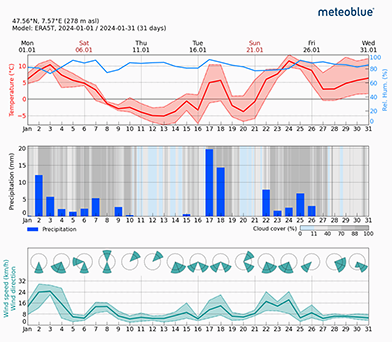
Weather Archive
The meteogram Weather Archive shows the historical simulated temperature, relative humidity,
precipitation, cloud
cover, wind speed and wind direction for any desired period and location.
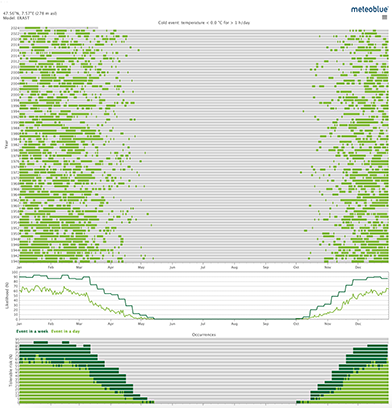
Risk Assessment
The Risk Assessment diagrams show the probability of a specific, customisable weather event
to occur, for any
location on earth. The diagrams are available for cold and warm events, precipitation, water
capacity, cloud cover, wind speed and wind gust are based on more than 30 years of historical simulation data.
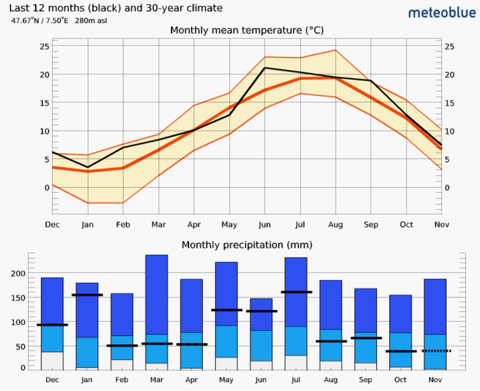
Meteogram Current to Climate
The meteogram Current to Climate compares weather variables of the current season to the 30
year mean climate,
for
the variables temperature and precipitation.
Meteogram Climate Observed
The meteogram Climate Observed shows the annual course of temperature, precipitation amount
and days, as well as
wind
measurements from the closest weather station, aggregated on a weekly or monthly basis.
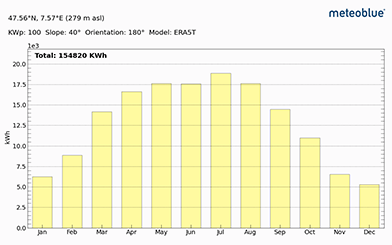
Meteogram Solar Season
The meteogram Solar Season shows the mean monthly solar power production unit over the last
10 years. The solar
power
plant can be specified with setting kWp, slope and orientation.
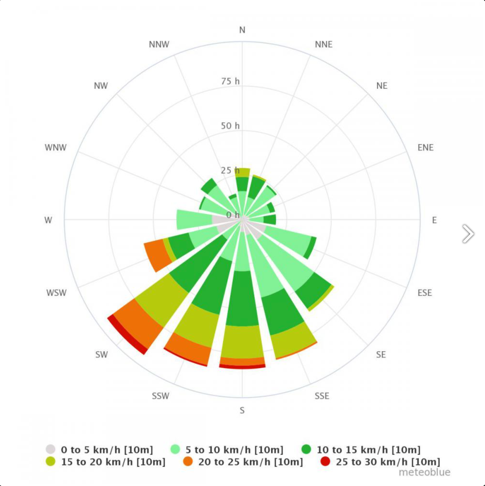
Meteogram Climate Wind Rose
The meteogram Climate Wind Rose shows how many hours per year the wind blows from the
indicated direction. The
data
is accumulated from 30 years of historical weather simulation data from the global meteoblue
model NEMSGLOBAL,
which
has a resolution of 30km.
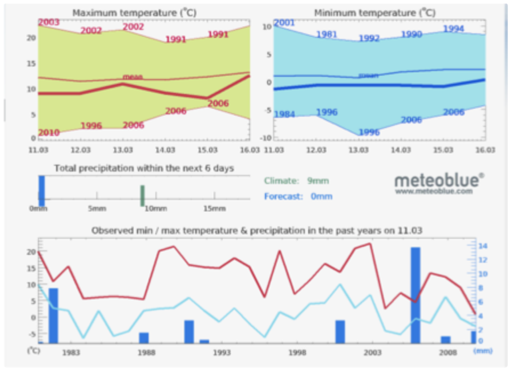
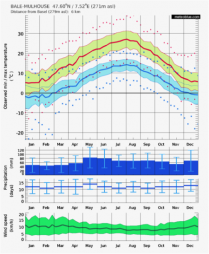
Meteogram Climate Comparison
The meteogram Climate Comparison shows the expected weather, compared to the weather of the
previous 10 (or more) years. Thereby, you can see how "normal" the current weather is.
Climate Comparison locates the nearest location with a weather station for which a minimum of 10 years of reliable measurements are available.
The name of the place where the station is located is indicated in the title, as well as the distance from the selected place.