Display and processing difficulties
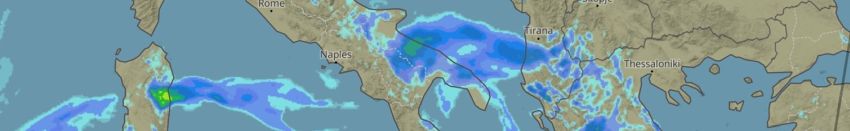
Precipitation Maps
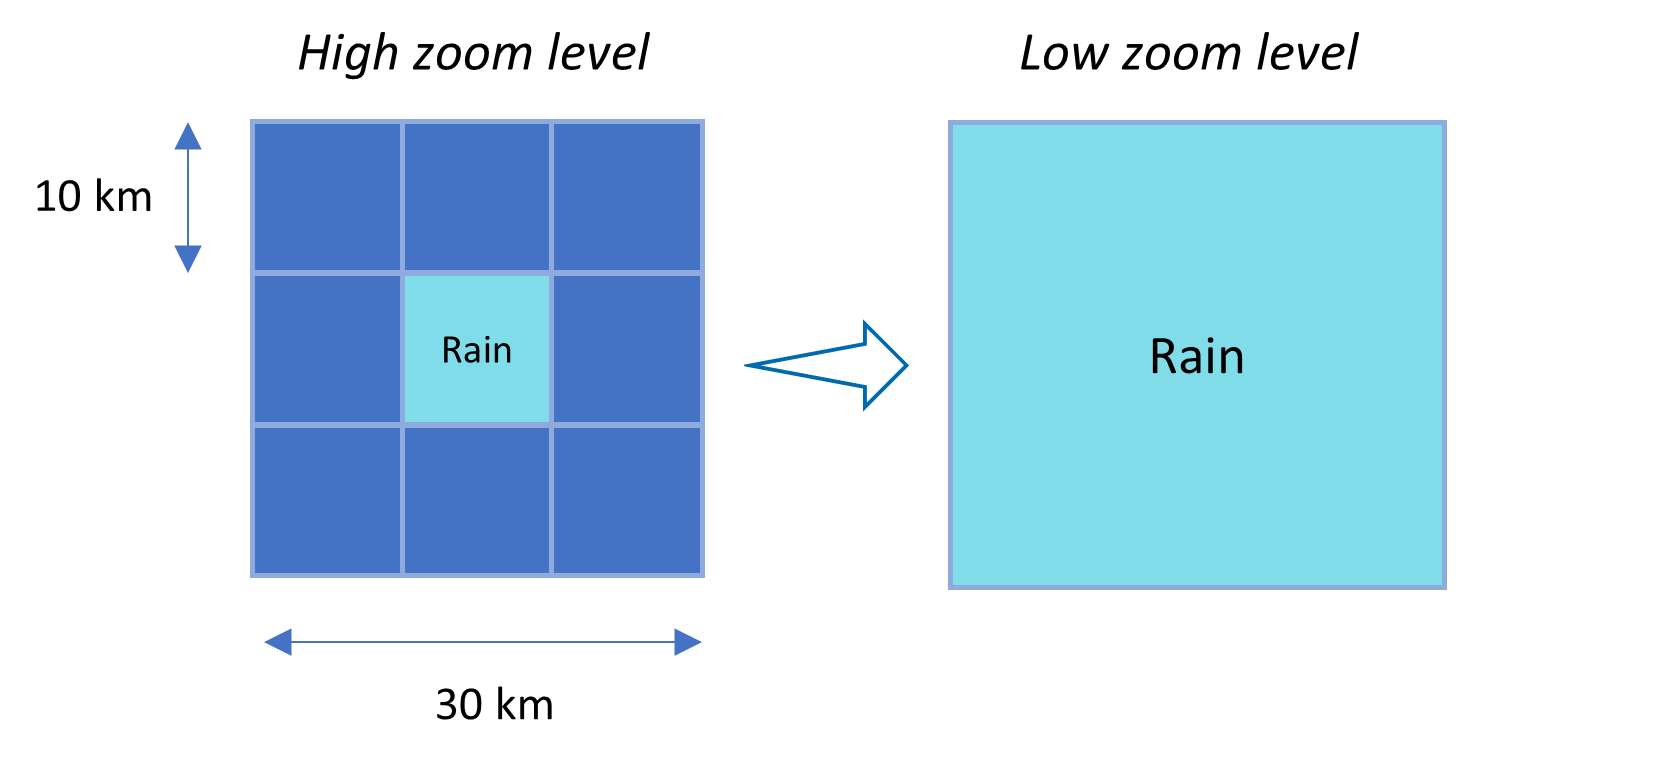
The meteoblue weather maps automatically select the data from the most adequate model, which changes with the map view area and zoom level (for example, for central Europe, zoom level 4 shows the NEMSGLOBAL data, zoom level 5 shows the NEMS12 data, and zoom level 6 shows the NEMS4 data). For precipitation, this has the consequence that the low-resolution maps appear to show a wider spatial precipitation distribution than the high resolution maps. Conversely, while the high-resolution maps show a more narrow spatial precipitation distribution, they show higher local precipitation volumes.
This can be explained easily: If one grid cell with a resolution of 30x30 km is composed by 9 grid cells with a resolution of 10x10 km, and if one of these smaller grid cells has simulated a thunderstorm, the whole 30x30 km grid cell in the low resolution view will show a thunderstorm, and be painted blue (= precipitation is present), as it cannot distinguish in which part of the grid cell the thunderstorm occurs: the low resolution model just knows that precipitation will occur somewhere within the large grid cell. And simultaneously, it will average the precipitation volume of this local event over the whole grid cell, which will reduce the intensity.
Data merge within our API
As the inconsistent nature of precipitation does not allow meaningful bias-correction (just as MOS-postprocessing does also not provide improvements) as it can be done automatically for other variables, merging of different models and time series is not possible without leaving substantial data inconsistencies. As already mentioned, this is important to consider when collecting long time series of precipitation data from the meteoblue history API. Whenever the considered location and time range (as high resolution is limited to a certain time-range) allows, the API delivers high resolution data, otherwise it will deliver low resolution data, going back till 1985.
To avoid this inconsistency within the history+ interface, it is important that the correct precipitation dataset as requested, depending on the specific requirements of usage. Note that when for a specific location no local model exists at all, by choosing the high-resolution model, the API delivers the low resolution global model anyway. The resolution available locally can be confirmed easily by looking at the grid cell size of the rainSPOT underneath our 7-Day Weather forecast.

Note that this issue does not apply to our regular forecast, as it is the result of a multimodel composition, to which no specific resolution can be attributed.
