
Pictocast - the all-in-one
point Pictocast summarises the local weather forecast using pictograms, tables and spot diagrams.
We show two types of pictocast:
- The day overviews show the entire forecast period in a summary.
- Detail overviews show the 3-6 hourly development over part of or the entire forecast period.
Day overview
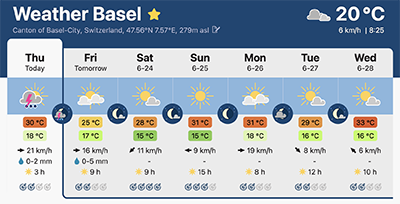
- Weather conditions
- Shown by pictograms.
- Temperature
- Shown as maximum/minimum during the day, and highlighted by colours to facilitate recognition. It corresponds to the temperature at 2 m above ground. Normally, the maximum temperature is expected at late afternoon and the minimum at late night.
- Wind speed and direction
- Given in km/h at 10 m above ground. If no definition is shown, it represents the maximum wind speed expected during the day. Wind direction is represented by arrows (pointing in the direction in - not from - which the wind blows).
- Precipitation
- Amount for 24h in mm.
- Sunshine hours
- Amount of sunshine hours compared to the total day length.
- Predictability
- Allows to know how accurate the forecast is - very high, high, medium, low, very low. The predictability usually decreases with the time as we do not always know very well how each variable will behave in the next few days.
Detail overview

- Temperature
- °C at 2 m above ground at the time (hour) indicated.
- The temperature felt indicates the temperature that someone should feel being outside, according to the different weather variables like the wind or the humidity.
- Wind speed and direction
- The wind speed and wind gusts are in km/h at 10 m above ground at the time (hour) indicated. The wind direction is represented as symbols for azimuth degrees (0-360°) 10 m above ground at the time (hour) indicated.
- Precipitation
- Shows the accumulated amount during the previous 1h in mm and the probability of occurrence. It behaves like a rain gauge: "5 mm at 12:00" shows the amount of precipitation from 11:00 to 12:00. The rainSPOT diagram shows the intensity and amount of precipitation events in the surrounding area.
- Sun and moon
- The final element shows the rising and setting times for the sun and moon, the UV-index and moon phase, as well as air pressure information and the timezone.
A pictocast summary is available for printing here. You can also change the place you want for the pictocast in the Location box.
