Synoptic Charts
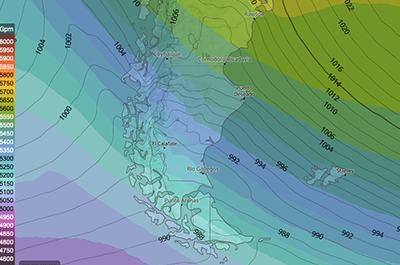
Sea level pressure
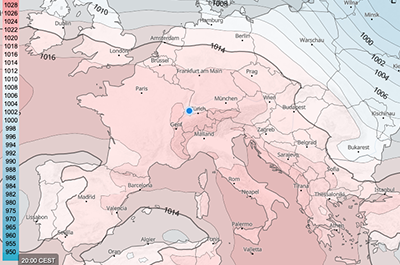
These maps show the air pressure (at sea level) in hPa, shown with isobars and colours as indicated in the map legend. For more information, see pressure.
Pressure & 3h tendency
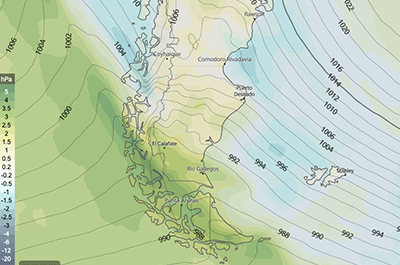
These maps show the increase or decrease of the air pressure within the last three hours of the selected time. The pressure is given in hectopascals (hPa). Positive values indicate an increase in air pressure within the last three hours, negative values indicate a decrease. For more information, see pressure.
Measured temperature
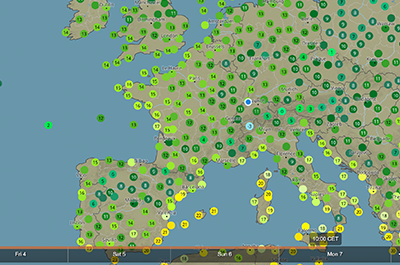
This map shows temperature values transmitted directly from measuring stations.
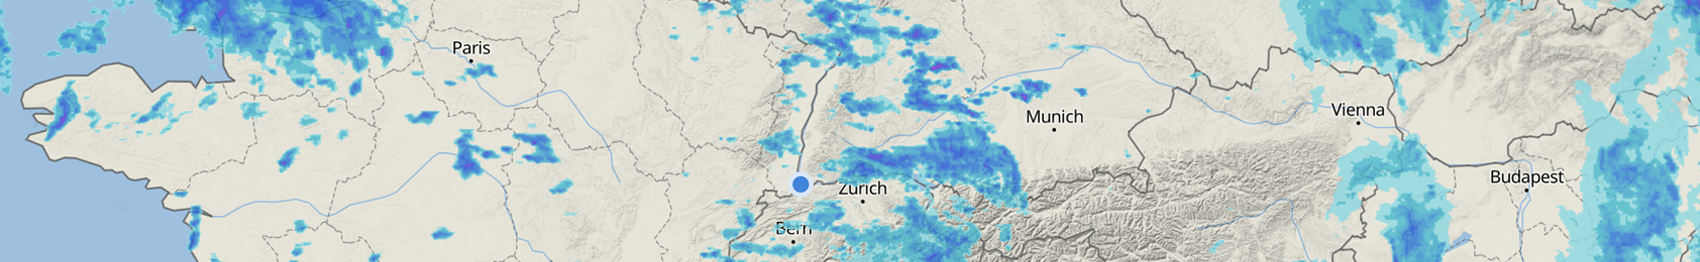
Measured precipitation
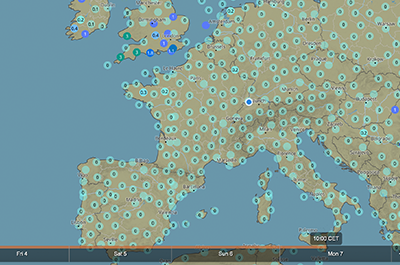
This map shows hourly precipitation values in millimetres (mm) transmitted directly from measuring stations.
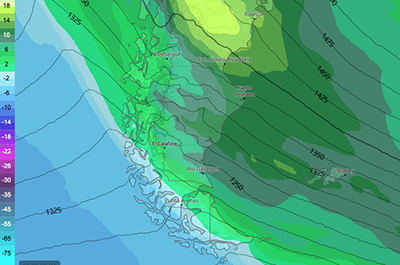
500 hPa height
The map shows at what altitude in geopotential meters (Gpm) the air pressure corresponds to 500 hPa. The colour scale indicates where the equipotential surface is increased and where it is decreased. The 500 hPa pressure area has a special meteorological position. On the one hand, it divides the mass of the atmosphere roughly into two halves, and on the other hand, the processes occurring there (wind currents) have an outstanding influence on the weather pattern. For more information, see pressure.
1000-500 hPa thickness
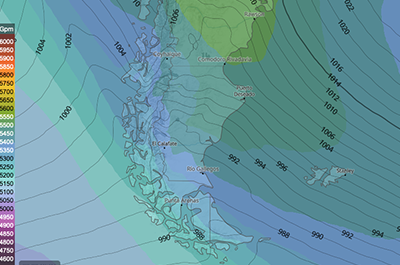
The 1000-500 hPa thickness map shows the thickness of the air layer between 1000 and 500 hPa in geopotential meters with the help of colours according to the thickness. The mean sea level pressure is shown in hPa with isobars.
Temperature & height (GPH)
These maps show coloured areas of equal temperature for an equipotential surface (e.g., 500 mb). Combinations with other maps are possible: For instance, isohypses may show the mean sea level pressure (hPa), whereas large scale airflow currents will be visible by adding streamlines for the specific altitude. For more information, see pressure.
Jet stream (250 hPa)
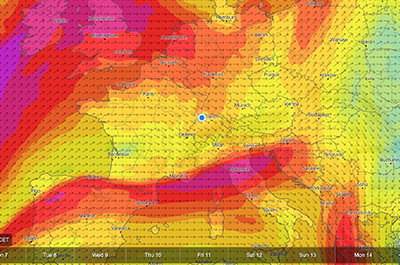
These maps show the wind speed in the height of the 250 hPa pressure level. Wind speed is indicated with colours, whereas the wind direction is shown with streamlines. The 250 hPa pressure level is the altitude of jet streams. Jet streams are strong and generally westerly winds in the upper troposphere. They are narrow and meandering currents with wind speeds up to 400km/h. There are mainly two different kinds of jet streams in the atmosphere, each of them occur on the northern and southern hemisphere: The polar jet stream and the subtropical jet stream. For more information, see wind.
