Technical limitations
Spatial resolution
Our verification studies (Section NEMS verification) showed that the accuracy of the precipitation simulation from the highest resolution model (4 km in Europe) is on average lower than from the lower resolution models (12 km and 30 km), due to the small-scale occurrence of precipitation events. This can be understood by imagining a small thunderstorm moving ahead. With a grid cell of 4 km, it is likely that the actual track of the thunderstorm goes through different grid cells than the simulated track.
As a result, the simulation will produce two wrong grid cell tracks: one, where the thunderstorm was simulated but did not pass, and one, where no thunderstorm was simulated but actually passed. Going to a lower resolution model reduces this issue, as the shift between simulated and actual track would have to be much larger in order to have the same probability of predicting two grid cell tracks wrong simultaneously. The most precise raw model results are obtained with a spatial resolution of 6-12 km. The 12 km simulation proved to be more accurate than the 30 km resolution simulation. Exceptions from these results are found in mountainous areas, where the higher resolution models produce better precipitation accuracy than the lower resolution models, because the former have a better grasp of the topography.
Availability of low and high resolution data at meteoblue
Historical weather data: Our history+ interface allows to choose between high- and low-resolution models. Model availabilities depend on the selected location. In the history+ interface, you can select between different weather models (ERA5 re-analysis model with 30 km resolution, NEMS low-resolution with 30km and a regional NEMS model). Remember that high-resolution data is only available for a limited time range, depending on the chosen model. The data availability is also documented in the model selection drop down.
Forecast data: Our forecast API does not differentiate between different raw models, as the delivered data is a Multimodel composition based on multiple weather models with different spatial resolutions. In addition, nowcasting is applied when data is available. Consequently, the forecast is calculated specifically for the selected coordinate.
General performance of weather models
Weather models are based on equations that calculate atmospheric conditions to capture reality as accurately as possible. Within these approximations, each model carries its own uncertainties, which result in certain unavoidable forecast errors. For some weather variables, these forecast errors appear more often, than for others. Especially in the case of precipitation, we want our users to understand the reasons for possible forecast errors, on which we have no influence in some cases.
More information on weather model theory can be found here.
Besides our own models, meteoblue collects and distributes a wide range of different precipitation datasets from third-party operators. Next to a large number of own global (2 models) and regional models (14 models), the database of meteoblue also contains forecast models like GFS (NOAA) and ICON (DWD), reanalysis models such as ERA5 (ECMWF), satellite observational datasets like CHIRPS2 and CMORPH that are further improved by corrections with precipitation measurements, as well as radar data for some regions (due to various reasons, no comprehensive radar data for the whole world can be offered). As all these datasets come with different advantages and inaccuracies, where striking differences in accuracy can occur, depending on time and location of inquiry. More information can be found on our verification pages.
In conclusion, it is not possible to easily define one dataset to have the best accuracy for all uses and locations. Furthermore, it is difficult to estimate which dataset has the best quality in this situation, without high quality measurement within reasonable distance.
Errors in radar observations
As is the case for almost all measurement and acquisition data, radar images can contain significant errors. The frequency of errors depends on the quality and maintenance of the radar device as well as the quality control measures taken by the operators.
Usually, countries operate their own radar networks. meteoblue makes use of a selection of the datasets thus provided to display as a weather map layer. That means, whenever a radar device has technical errors, these errors can be seen in our maps as well. It is important for our customers and users to understand that we do not have direct access to the devices and thus have to rely on local maintenance workers to solve any issues - which means that we cannot always guarantee a flawless radar display on maps.
Attenuation of radar beams
If a heavy shower such as a hailstorm develops in close proximity to the radar devicewhile an intense rain event is already ongoing in the same direction but at a further distance, the shower may attenuate the radar beam to such an extent that the original heavy precipitationis no longer detected by the device. Similarly, a heavy rain shower can also interfere with the detection of a hailstorm.
Overall, this phenomenon can skew the forecasts of extreme precipitation events. When using a radar network, i.e., a system comprised of several radars, this problem can be largely eliminated. In the case of local, stand-alone radars, such as airborne weather radars, however, this prediction error must be considered.
Similarly, other obstacles such as television towers, radio masts, and wind turbines can inhibit the precipitation echoes, creating gaps in the radar.
Ghost echoes
Another phenomenon that can affect radar quality are so-called ghost echoes, which often occur during inversion weather conditions. They form when radar beams are refracted at inversion boundaries and reflected towards the earth's surface. The radar then identifies this so-called "ground target", which is hit by the reflected beam, as precipitation.
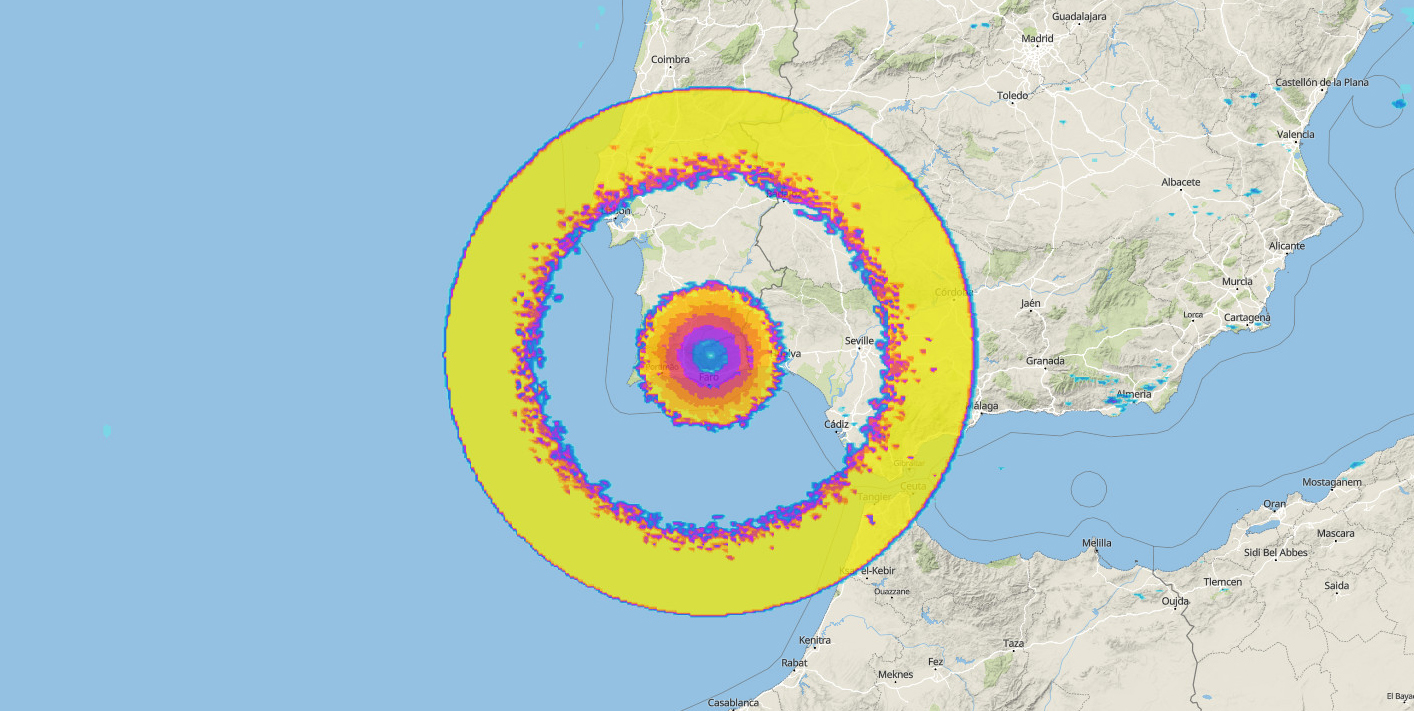
Sometimes we see a circular ghost echo, which indicates a badly adjusted radar. The figure below shows a very odd radar image, which was clearly caused by a malfunction.
It is also possible that radar beams are reflected at the water surface. In such cases, many small precipitation clouds are created in the radar image, which, however, are not actually indicative rain.
Overall, in the case of odd patterns, the comparison with METAR and satellite data can be used for a better interpretation of the radar image.
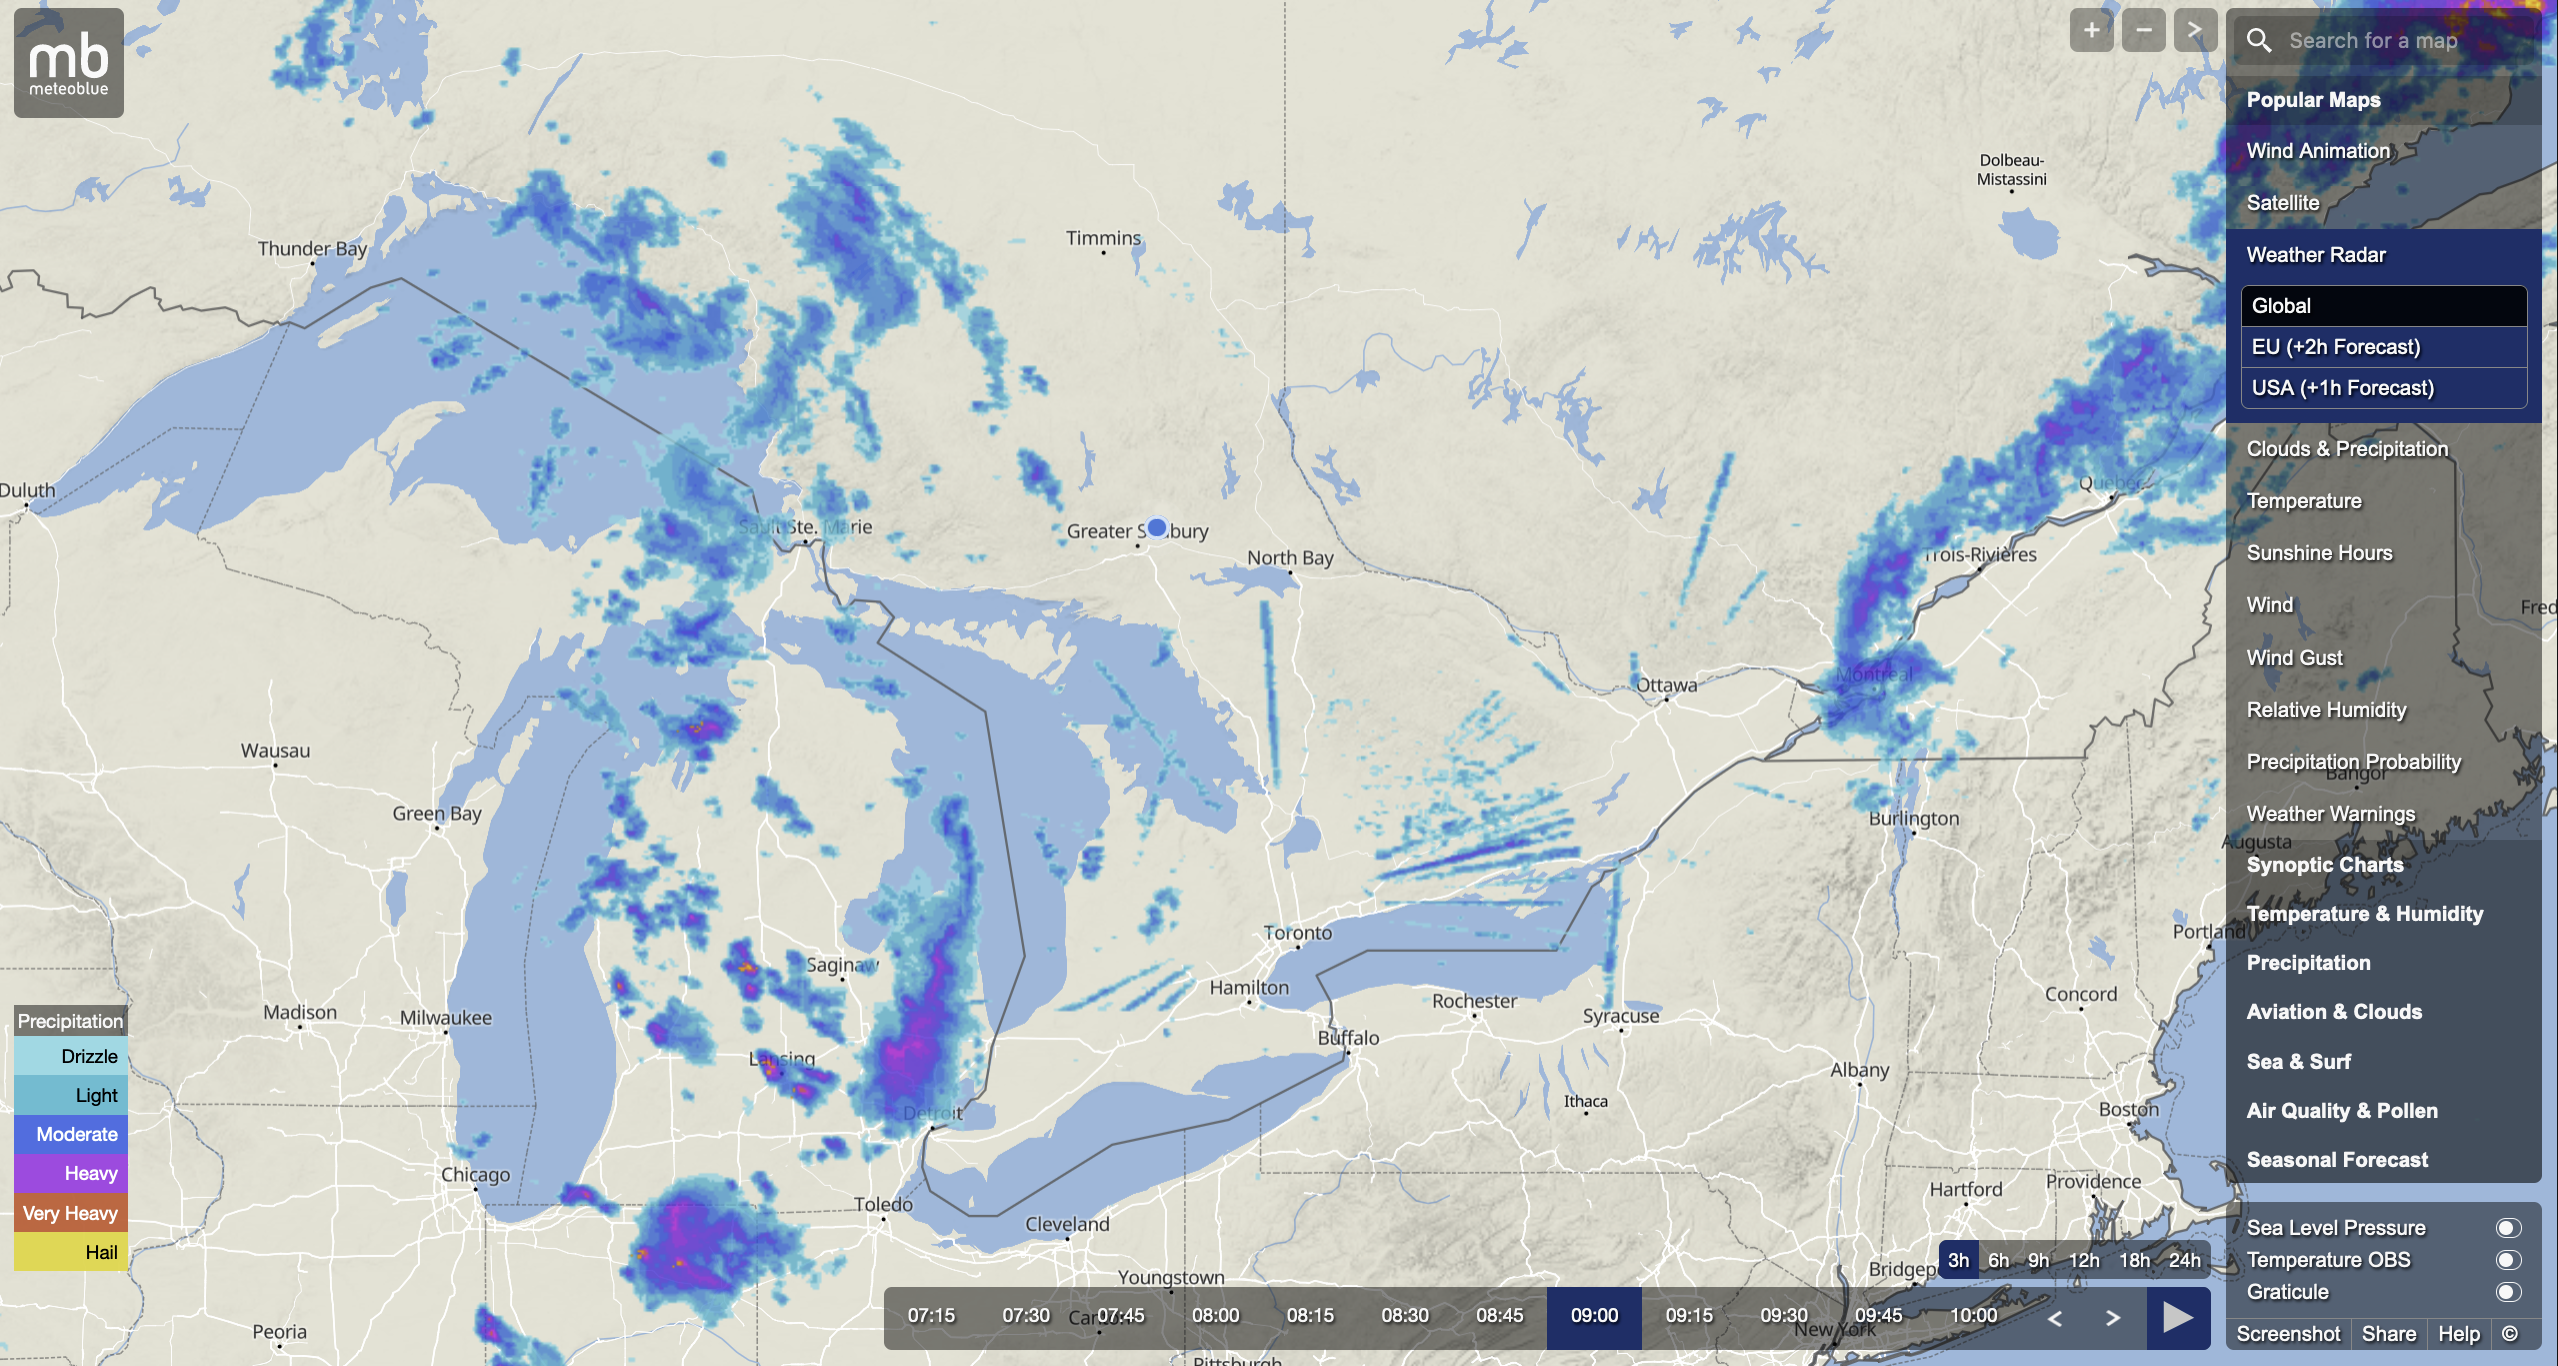
Stripes in the radar image
Sometimes, stripes like the ones shown in the image below can appear, which are an example of interferences that may be caused by cellular towers. With the constant expansion of new and multiple cellular towers, this phenomenon may occur more frequently and thus affect the prediction of precipitation via radar data.