
Meteogram AGRO
meteoblue offers a suite of meteograms designed specifically for farmers, agronomists, gardeners, and other agricultural enthusiasts - Meteogram AGRO, Sowing Windows, Spraying Windows, and Soil Trafficability. These specialised meteograms, developed using our meteoblue Learning MultiModel (mLM), combine various data sources for unparalleled accuracy. Vital for efficient farm management, the meteograms are accessible through a subscription to point+ or the meteoblue Weather API.
Temperature and basic conditions
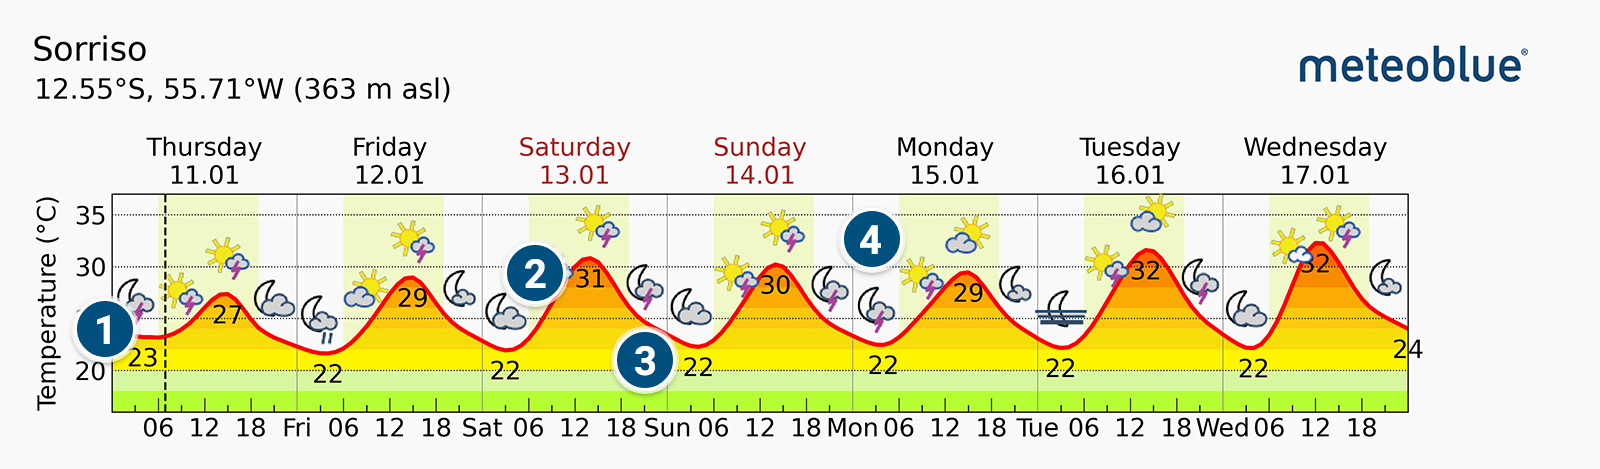
In the top part of the meteogram, you can find air temperature at 2 meters above ground, indicated by a colour curve (1) in hourly intervals. In addition, daily maximum (2) and minimum (3) temperatures are added. The weather symbols (4) in the same diagram briefly summarise the weather conditions.
Precipitation and clouds
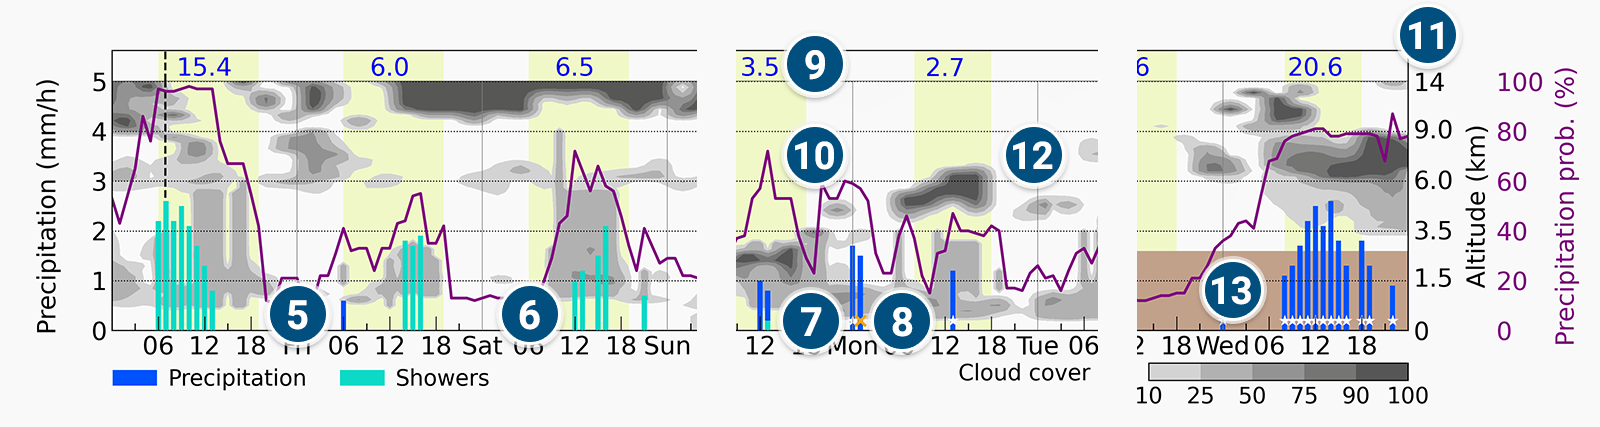
The second part of the chart shows precipitation data. The dark blue bars (5) indicate rain events, the light blue bars imply showers (6), the dark blue bar with a white snowflake stands for snow (7), and the light brown cross indicates frozen mix (8). The daily precipitation sum is shown at the top of the second diagram (9). The precipitation probability (%) is displayed as a purple curve (10). Furthermore, you can find cloud cover data in this diagram, namely information about cloud altitude above sea level (11) and cloud coverage. The cloud coverage is shown in grey scale. (12). A brown bar is shown for locations at high altitudes (13).
Spraying windows
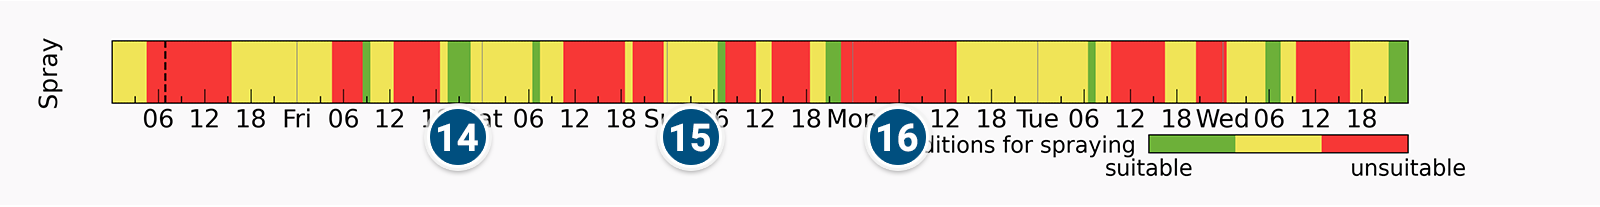
Below precipitation info, you can find the spraying window info. It helps you identify periods suitable for applying crop protection measures. Suitable periods are in green (14), less suitable ones in yellow (15) and unsuitable in red (16). The conditions are derived from data about wind, precipitation, temperature, and humidity (see the table below). The input must be verified before the application by checking the current weather conditions.
| Variable | Unit | Low risk | Medium risk | High risk |
|---|---|---|---|---|
| Wind speed | (m/s) | < 2 m/s | > 2 m/s | > 5 m/s |
| Minimum temperature | (°C) | > 5°C | < 5°C | < 0°C |
| Maxiumum temperature | (°C) | < 30°C | > 25°C | > 30°C |
| Relative humidity (min) | (%) | > 50% | < 50% | < 30% |
| Relative humidity (max) | (%) | < 90% | 90% - 98% | > 98% |
| Amount of precipitation (water) | (mm/h) | < 0.1 mm/h | 0.1 mm/h - 0.3 mm/h | > 0.3 mm/h |
Evapotranspiration and humidity
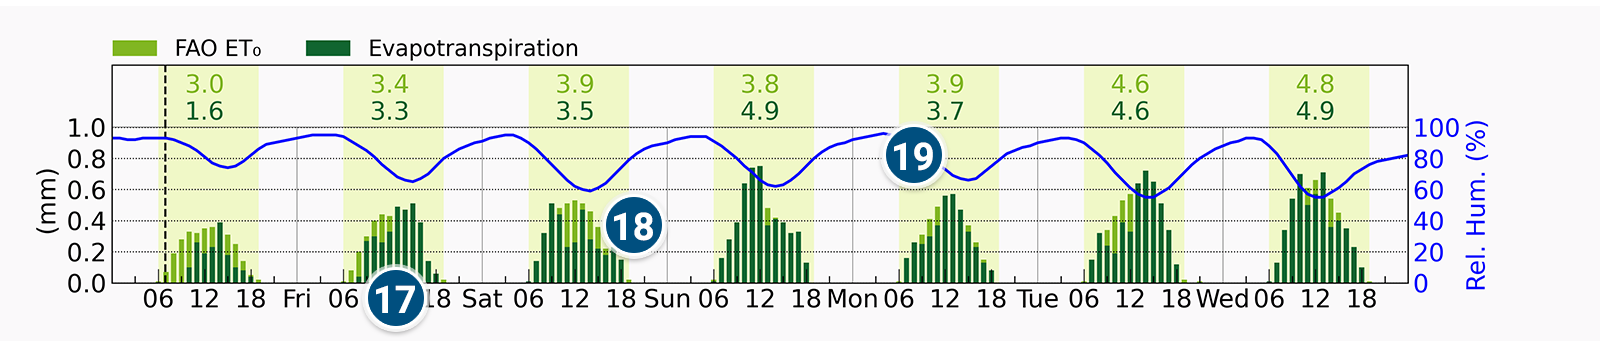
The fourth part of the diagram shows the balance of evapotranspiration in dark green (17) and reference evapotranspiration FAO ET₀ in light green (18) in mm. You can find the daily sum of both at the top of this diagram, indicated in their respective colours. Finally, the blue line (19) shows relative humidity.
Wind speed and gusts
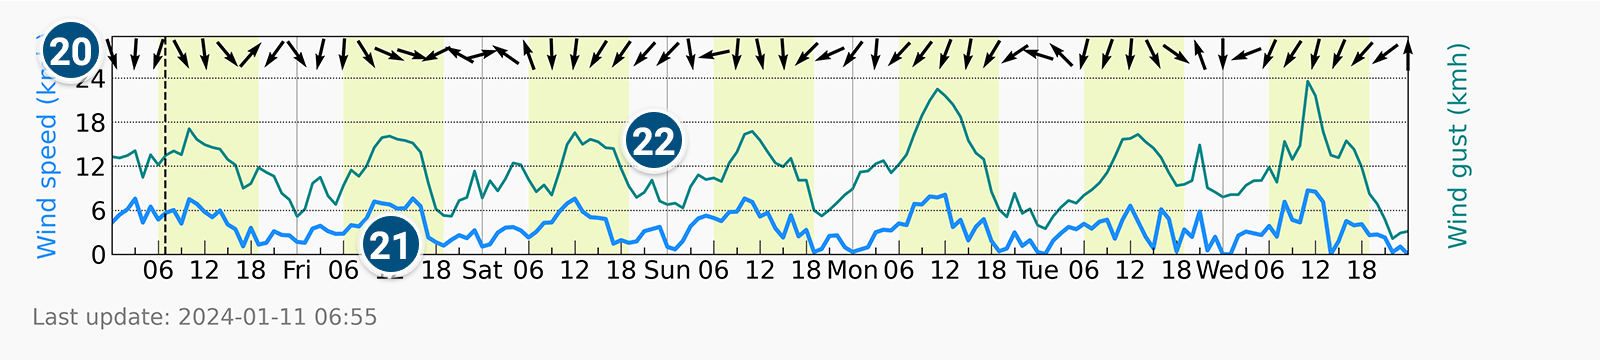
The bottom part of the diagram shows the most important wind variables. It displays the wind direction with wind barbs (20), wind speed by the blue curve (21) and wind gusts by the dark green curve (22) in hourly intervals.
