
14-Day Weather
You can find the Meteogram 14-Day on the meteoblue website.
The Meteogram 14-Day shows the weather forecast for the next 14 days period, with weather symbols, a range of maximum, average and minimum temperatures and precipitation amounts, as well as the precipitation probability for each day. The range between possible minimum and maximum values shows the possible weather developments.
Description
The weather symbols and the daily temperature maxima and minima appear below the dates (defined in current local time), to give an approximate overview of the expected weather conditions.
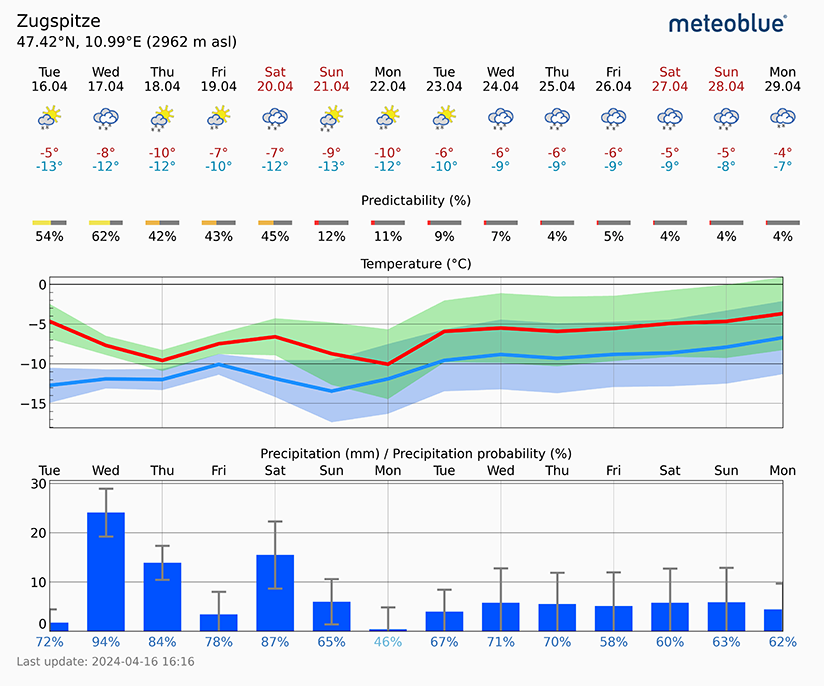
Weather symbols
The weather symbols are chosen based on the most likely outcome for each day. For very different developments (low convergence, see below), this outcome may differ from the average scenario, which can then lead to occasional inconsistencies between symbols and precipitation amounts.
Temperature
The temperature diagram below the first tabular block also refers to the days listed above. It specifies the expected maximum and minimum temperatures for each day (in local time). The diagram shows the max-min range which is predicted for these temperatures by various weather model runs (ensemble). The thick line in the middle of each range is the most probable development, and the upper and lower lines indicate the most extreme development.
Precipitation
In the precipitation diagram, you see the daily precipitation amount as bars relative to the left Y-axis, with a range of minimum and maximum amounts possible indicated by black lines. The probability of precipitation below the diagram, ranges from 0 to 100%. The darker the precipitation probability number, the more likely is the precipitation:
- The percentage is light blue when the probability of precipitation is less than 25%.
- The percentage is dark blue when the probability of precipitation is above 90% and purple above 95%.
The concepts of probabilities and pictograms do not always correspond for a single event. However, the probabilities and pictograms should match in a statistical sense: if there are 100 cases with 30% probability, then in 30 cases a pictogram with precipitation, and in 70 cases a pictogram without precipitation should be visible.
Interpretation
The interpretation of the Meteogram 14-Day can be helpful to detect the risk of extremes. A useful approach is monitoring the forecast daily during the critical periods of the season. If an extreme event (frost, very high temperature, heavy precipitation) shows up on day 14 of the meteogram, watch for the following events:
- Convergence - The difference between maximum and minimum model run. This is an approximation of how much the
different model runs “agree”.
- High convergence: event is more likely to occur;
- Low convergence: event is still uncertain.
- Consistency:
- All weather variables indicate the same (e.g. extreme drop in temperature, increase in wind and clouds, precipitation: blizzard arriving): severe event.
- Few weather variables indicate the same (e.g. rainfall but no drop in temperature, few clouds): event uncertain or not very strong, continue watching.
For commercial use, please consult our product page meteoblue API.

