
Weather Archive
The weather archive offers access to past weather simulations for every place in the world. You can see weather information for yesterday or the weather history since 1985. The weather archive diagram is separated in 3 charts:
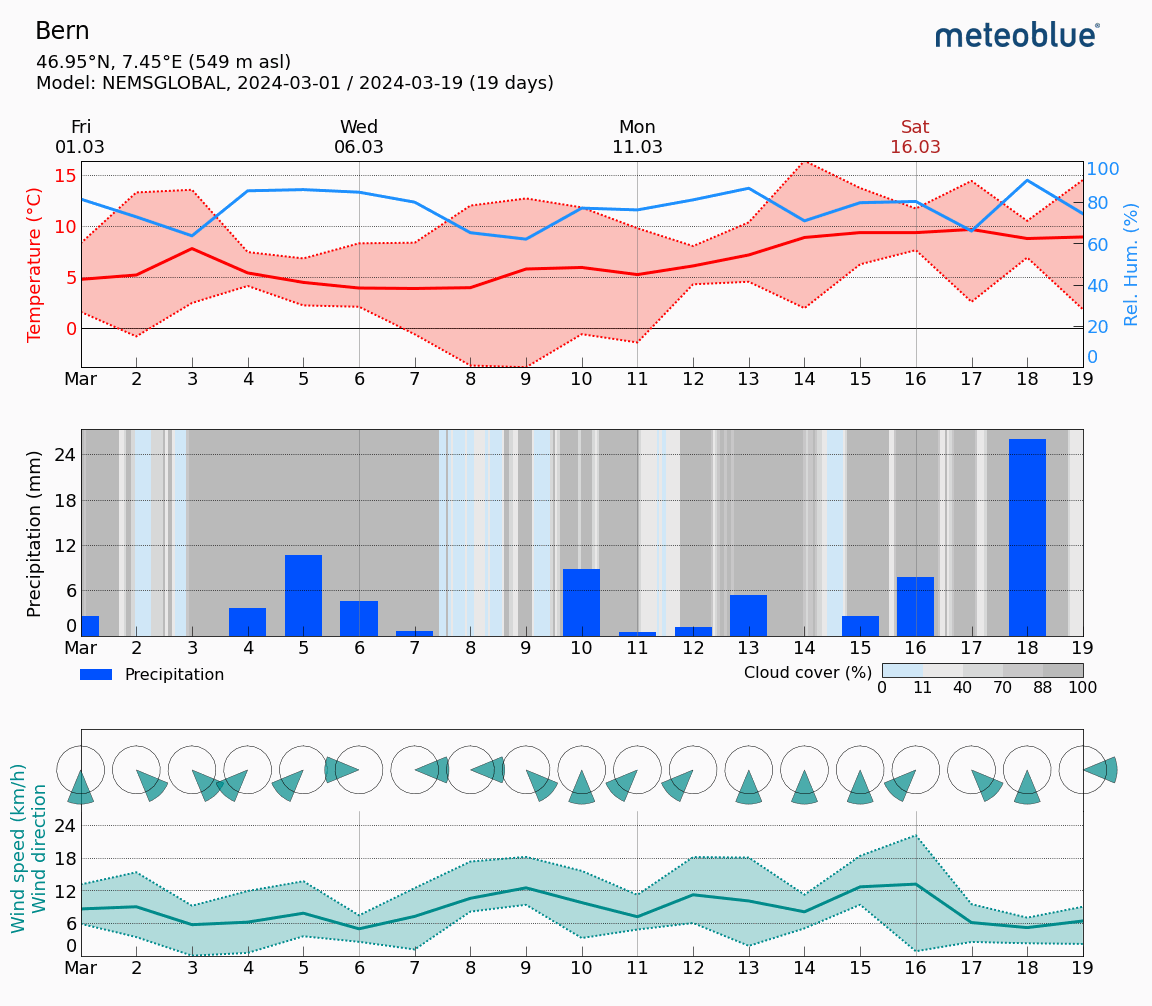
- Temperature (red line) and relative humidity (blue line) for the first 15 days; min, max, mean temperature for greater time intervals
- Precipitation amount (blue bars), clouds (grey background), sunshine (light blue background). The darker the grey background, the more dense is the cloud cover.
- Wind speed and direction (in degree 0° = North, 90° = East, 180° = South and 270° = West). In the Weather Archive meteogram, the green line represents wind speed, and the wind rose shows the wind direction.
Please take into account the following considerations:
- The weather archive shows simulation data, not measured data, for the selected area. The spatial resolution (size of the area considered) is 1/3 of the radius in the rainSPOT.
- Wind and temperature data are calculated with the average altitude of the grid cell. Therefore, temperatures for places in mountains or on coasts can be slightly different from those indicated in the diagram. We indicate the altitude of the simulation besides the coordinates.
- The "15 day" diagram shows hourly data. For one month, there are daily aggregations for minimum, average and maximum values. For more than 6 months, the diagrams show monthly aggregations.
- The data are simulated and not compared to measured data of a weather station (because in more than 99% of the places on Earth, no measurements are available). Simulation data with high predictability can replace measurements. For areas or weather variables with lower predictability, simulation can not replace measurements and not be used as evidence without professional interpretation.
- Situations where simulation do not completely substitute measurements are: Events like showers, thunderstorms, lightning, hail, snow and local winds, as well as weather variables such as local precipitation amount, wind gusts or quarter-hourly radiation and some others may not be reproduced in sufficient detail with the simulation data to permit a perfect reproduction of reality.
- The accuracy of the simulations can be determined with a few methods described on our validation page.
We also offer raw history data for sale. For data requests, please contact us ([email protected]).

