
Wind speed
- The meteoblue MultiModel approach markedly increases the accuracy of the forecast.
- meteoblue performs best when our 24-hour wind speed forecast is compared to raw models.
- Different raw models for wind speed and wind direction perform in a very similar fashion.
- Out of the compared prediction models, ICON has the highest overall performance.
- GFS05 predicts wind speed with the accuracy as 1.5 m/s higher than other raw models.
- Wind speed forecast is less accurate on islands and in mountain ranges.
- The forecast for wind speed is generally more accurate at continental locations than in proximity to oceans.
- Regional variations within the raw models exist, and are especially salient in the NEMSGLOBAL model.
- The model performance of wind speed prediction models becomes less reliable with the increase of wind speed.
The weather variable of wind plays a key role in weather and energy research. The increased energy consumption and ongoing climate change lead to a growing interest in renewable energies. The solar and wind energy sectors have been growing rapidly. Wind speed data are essential for finding suitable locations for wind turbine locations.
Additionally, extreme weather events are expected to become more frequent in the future. Companies such as insurers or agricultural producers depend on reliable data on wind conditions. Moreover, understanding wind dynamics helps in deciphering the influence of wind on other weather variables such as temperature or precipitation, and the general comprehension of the atmospheric system.
As a precise wind forecast is key for many of our customers (from wind energy companies to outdoor enthusiasts), it is essential for us that our customers can understand and interpret our forecast and its performance. Several verification studies have been conducted and are outlined in the following sections. In these, multiple numerical weather models were compared.
Analysis of global wind forecasts
The following findings are based on the master's thesis by Brigitte Häuser in 2021. Several wind speed weather simulation models such as ICON, MFGLOBAL, GFS05, models from the NEMS family (NEMS4 and NEMS12), as well as a reanalysis model ERA5 were compared on a global scale. For validation, over 5000 hourly METAR measurements were used from locations around the world, and throughout the entire year 2020.
Several statistical error metrics and forecast performance metrics were calculated and used for comparison. Further spatial analyses indicate the model performance of weather forecast models on a regional basis. Finally, a MultiModel approach was tested against other approaches in order to investigate their respective accuracy.
Raw model comparison
For comparison of the raw models, the mean absolute error (MAE) and the mean bias error (MBE) were calculated. The following figure shows that ICON and ERA5 have the lowest MAE, followed by GFS05 and MFGLOBAL. The wind speed forecast performance of NEMSGLOBAL is the worst, in comparison with other weather forecast models.
![Sorted MAE [m/s] for more than 5000 global hourly measurement stations provided by METAR and five models for hourly wind speed in 2020.](/assets/images/graphics/raw-model-comparison-page2.png)
Most of the weather forecast models tend to underestimate the wind speeds (see figure below).
![Density plot of the MBE [m/s] for more than 5000 global hourly measurement stations provided by METAR and the reanalysis model ERA5
and several prediction models for hourly wind speed in 2020.](/assets/images/graphics/raw-model-comparison-page3.png)
For further performance analysis, the POD (Probability of Detection), FAR (False Alarm Ratio) and HSS (Heidke Skill Score) were calculated. The thresholds 5, 15, 20 and 30 m/s were set to evaluate the performance of higher wind speed predictions. The main findings are summarised in the following table.
As for POD, wind speed over 5 m/s was most accurately predicted by NEMSGLOBAL, followed by GFS05, ERA5, ICON and MFGLOBAL. Nevertheless, when considering its HSS and high FAR values, the high POD values of NEMSGLOBAL are likely to be caused by a general overprediction of the wind speed, rather than a real prediction skill.
In comparison, ERA5 shows good prediction skills on wind speed over 5 m/s, and for higher wind speed, GFS05 performs the best. However, the probability and general skill of detecting wind speed over 15 m/s drops significantly for all models, meaning they all have general difficulties in predicting high wind speed events.
| Domain | POD_5 | POD_15 | POD_20 | FAR_5 | FAR_15 | FAR_20 | HSS_5 | HSS_15 | HSS_20 |
|---|---|---|---|---|---|---|---|---|---|
| ERA5 | 0.479 | 0.045 | 0.021 | 0.276 | 0.503 | 0.503 | 0.419 | 0.039 | 0.019 |
| GFS05 | 0.551 | 0.116 | 0.053 | 0.368 | 0.74 | 0.759 | 0.412 | 0.08 | 0.035 |
| ICON | 0.466 | 0.055 | 0.026 | 0.302 | 0.903 | 0.906 | 0.413 | 0.037 | 0.017 |
| MFGLOBAL | 0.37 | 0.069 | 0.04 | 0.286 | 0.691 | 0.674 | 0.31 | 0.047 | 0.028 |
| NEMSGLOBAL | 0.636 | 0.205 | 0.082 | 0.456 | 0.907 | 0.949 | 0.381 | 0.063 | 0.023 |
Spatial analysis
The spatial distribution of the MAE is shown below for the models ERA5 and NEMSGLOBAL, as they differ most significantly from each other. Overplotting of stations in close proximity was avoided by averaging the error metrics in 3x3° grid cells, resulting in a consistent grid net superimposed over the world map.
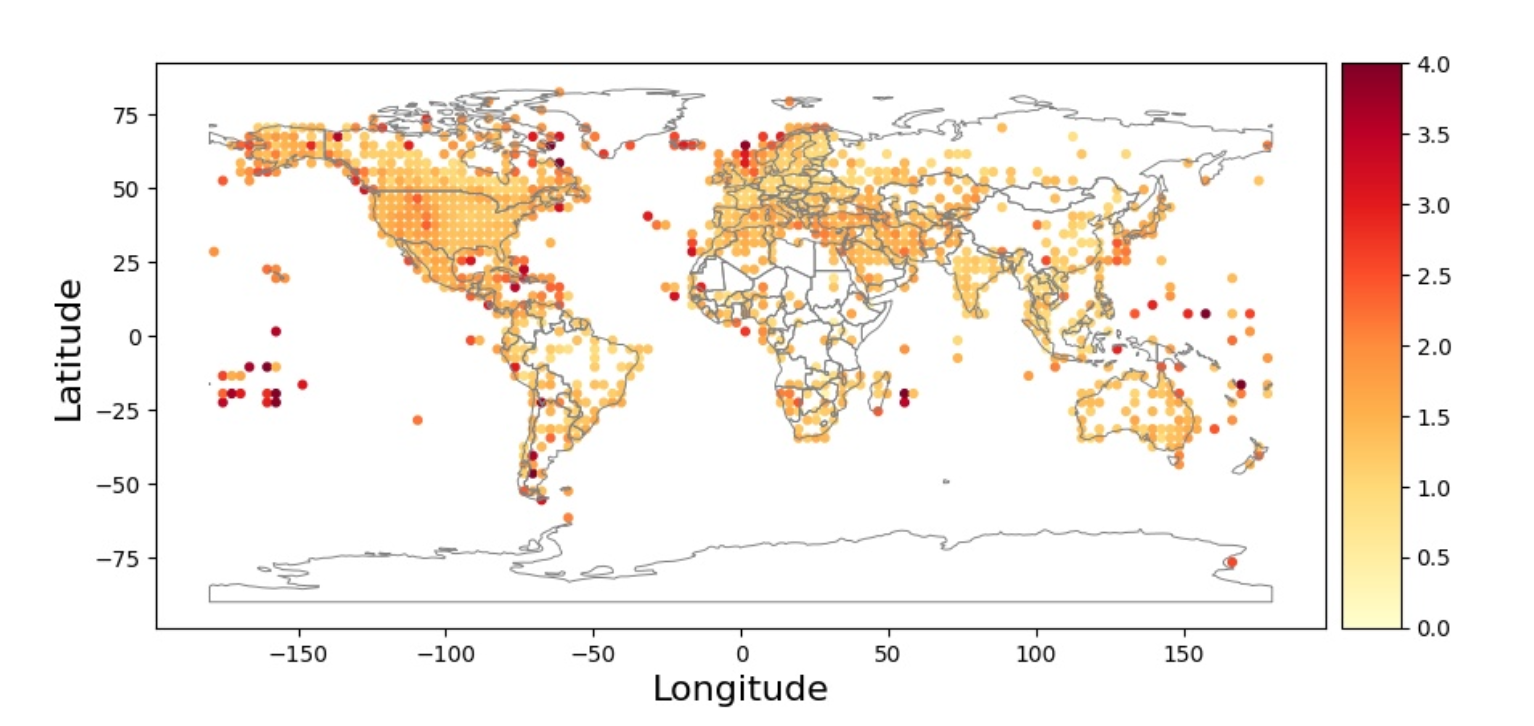
a) Reanalysis model ERA5
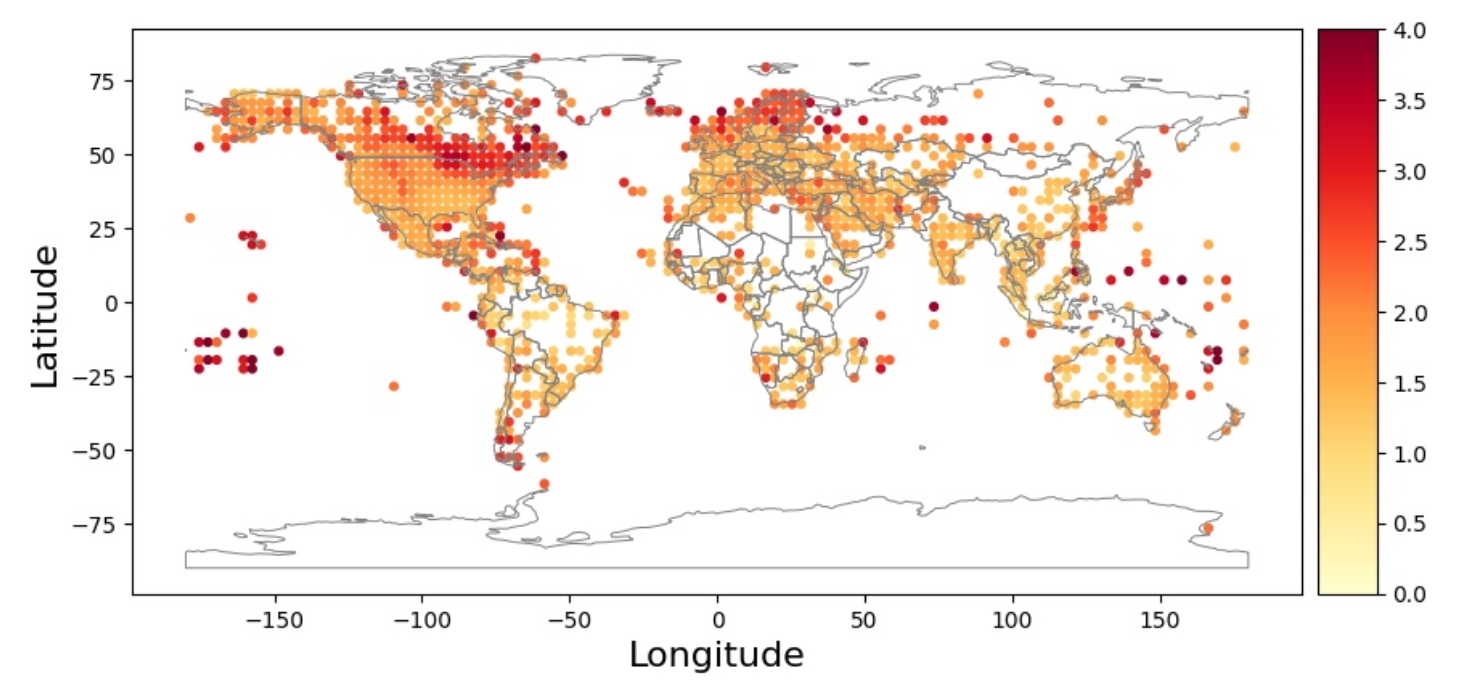
b) Prediction model NEMSGLOBAL
Spatial distribution of the MAE [m/s] for ERA5 (top) and NEMSGLOBAL (bottom) and over 5000 global hourly measurements by METAR in 2020.
The MAE of ERA5 is spatially distributed equally over the entire world. However, NEMSGLOBAL has the highest MAE values in Canada and Northern Europe, although the distribution of the MAE is comparable to the one of ERA5, only with higher contrasts. Both maps show a lower performance on wind speed forecast on islands, and (particularly in the map of NEMSGLOBAL) in mountainous regions such as the Rocky Mountains. In general, certain models demonstrate stronger spatial patterns, while others less so. For more detailed information please view the master's thesis (2,5 MB).
MultiModel approach
Within the MultiModel approach, several raw models are combined and weighted differently, which usually leads to improvements in the forecast's accuracy. As demonstrated in the previous section, raw models tend to perform with different spatial results. The combination of the forecast of multiple models for a specific location can lead to so-called “error cancellation”. For example, two models (one overestimating the variable and the other underestimating it) may balance each other out, resulting in a lower forecast error. In this section, the weather forecast models GFS05, MFGLOBAL, NEMSGLOBAL and ICON were combined to optimise the MAE, and also validated against METAR stations.
The study shows that ICON has the highest impact in this approach globally, as it was weighted the highest for almost all locations, except for locations in Russia and Northern Canada. Due to its high weighting, GFS05 has a major influence in the MultiModel approach as well. Averaging the best performing MultiModels of all stations (meaning all station-specific MultiModel combinations with the lowest MAE), we obtain an optimised MultiModel combination, in which ICON is weighted 50 - 60%, GFS05 20 - 30 % and MFGLOBAL and NEMSGLOBAL 10 %. This MultiModel was, in the final step, verified against all METAR stations.
The following table shows that this approach can improve the forecast of wind speed. While the MultiModel was optimised for the MAE, other error metrics such as the MBE, the RMSE (root mean square error), and MAPE (mean absolute percentage error) were also lower as compared to the raw models. The correlation (Cor) is an error metric which indicates the extent to which two data sets correlate or agree with each other. The higher the number (i.e., the closer to 1), the better the forecast. The table shows that the MultiModel outperforms the two best performing models ICON and ERA5.
| Domain | MAE | MBE | RMSE | MAPE | Cor | Cor >3 m/s |
|---|---|---|---|---|---|---|
| NEMSGLOBAL | 1.866 | 0.657 | 2.421 | 0.607 | 0.596 | 0.501 |
| MFGLOBAL | 1.617 | -0.490 | 2.070 | 0.474 | 0.612 | 0.514 |
| GFS05 | 1.563 | 0.130 | 2.002 | 0.483 | 0.635 | 0.537 |
| ERA5 | 1.460 | -0.152 | 1.860 | 0.429 | 0.652 | 0.577 |
| ICON | 1.453 | -0.355 | 1.925 | 0.422 | 0.682 | 0.577 |
| MM GLobal Weight | 1.369 | -0.122 | 1.768 | 0.401 | 0.703 | 0.598 |
Provider comparison
To classify our operational wind speed forecast, we compared it to the performance of the raw models, and to other weather forecast providers. The following figure shows the MBE of different prediction models (NEMSGLOBAL, ICON, GFS05, MFGLOBAL and UMGLOBAL), the reanalysis model ERA5 and the meteoblue forecast. The model outputs were compared to hourly measurements of more than 450 METAR stations worldwide. The analysis is based on 24-hour forecast and hourly measured wind speed data of the year 2021.
meteoblue forecast vs. raw models
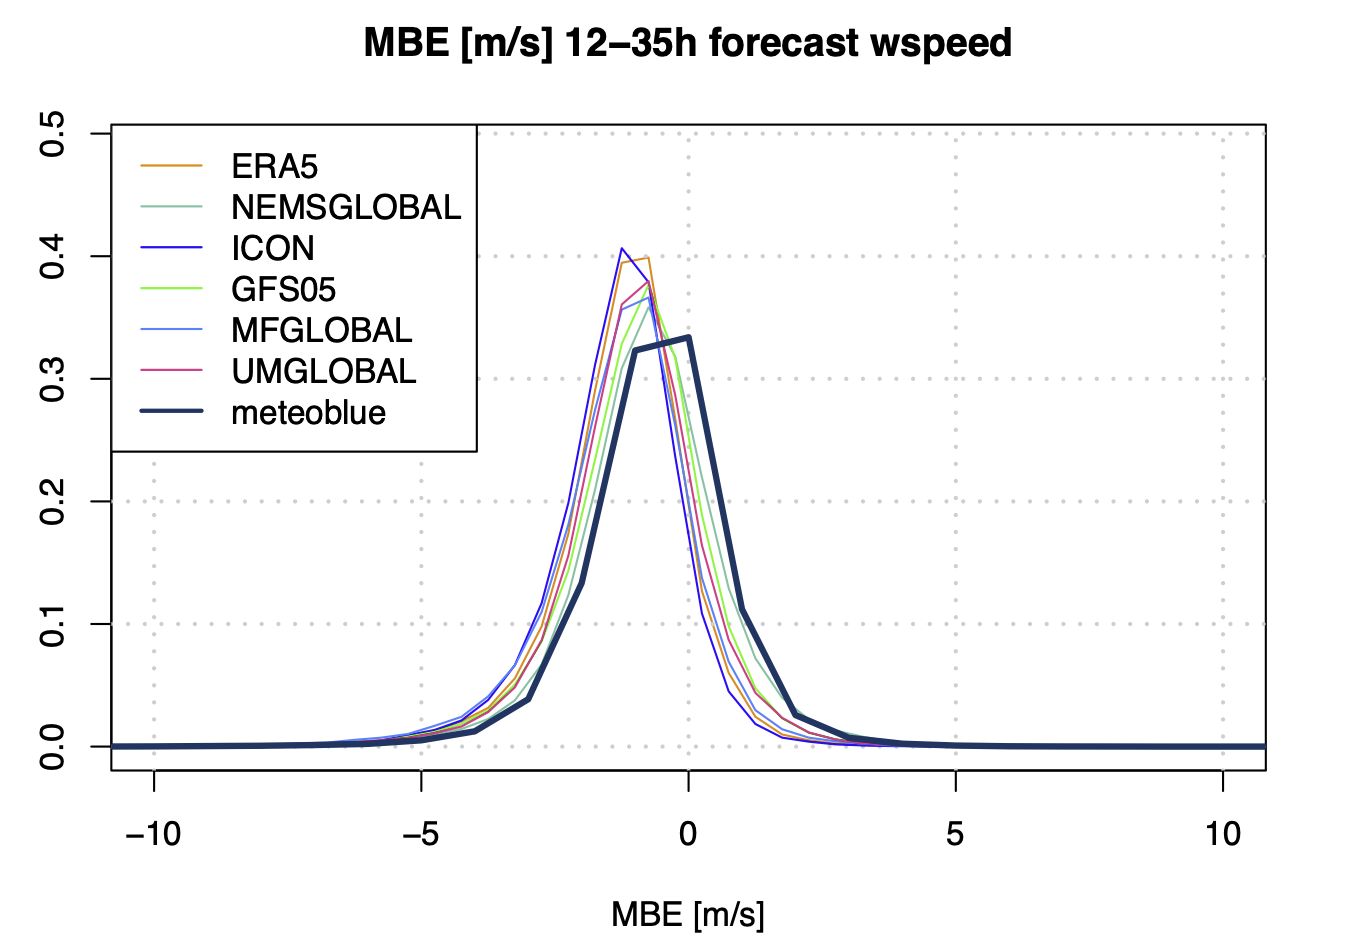
The figure above shows that for most of the models the MBE is negative, therefore the models underestimate the windspeed, whereas the highest peak for the meteoblue forecast is close to zero. This finding shows that the meteoblue forecast outperforms the reanalysis model ERA5.
meteoblue forecast vs. other weather data providers
The following table gives an overview of the error metrics MAE and MBE for the meteoblue forecast and 6 other weather data providers. In the case of the MAE, the meteoblue forecast has the lowest values, and therefore outperforms the other weather providers, although it underestimates the wind speed more than the other providers do.
| Provider | MAE [m/s] | MBE [m/s] |
|---|---|---|
| meteoblue | 1.36 | -0.53 |
| Provider_D | 1.41 | -0.42 |
| Provider_F | 1.38 | -0.29 |
| Provider_C | 1.41 | -0.36 |
| Provider_G | 1.48 | -0.09 |
| Provider_B | 1.40 | -0.14 |
| Provider_H | 1.51 | -0.11 |

