Air temperature
- meteoblue is one of the best weather forecast providers for 24-hour air temperature forecast.
- meteoblue demonstrates the highest 12-hour forecast accuracy.
- The meteoblue Learning MultiModel (mLM) used for the operational temperature forecast performs best, followed by a standard MOS, and the raw models.
- The mLM forecast outperforms the reanalysis model ERA5 forecast, which is the best of all other selected raw numerical weather models.
- On the global scale, temperature forecasts have the highest predictability on small oceanic islands and along ice-free coasts.
- Predictability decreases with increasingly complex topography and increasing distance from the sea.
Air temperature is one of the quintessential variables in meteorology, and being able to predict it reaps many benefits. In times of climate change, global temperatures are rising. The number of heat waves is increasing, which can have major consequences for agricultural production, for the urban population, and many other phenomena. For use cases such as these, a precise forecast of this weather variable is of key importance.
In this section, an overview of verification studies examining the forecast accuracy of the temperature 2 m above ground is given. Several verification studies have been conducted, in which the accuracy of different raw model forecasts, weather providers, different model approaches, and hourly measurements have been compared. On top of that, the regional variability of model errors has been examined. By offering a summary of our findings, we want to ensure that our customers can fully comprehend the temperature forecast, and its accuracy aspects.
Comparing different model approaches (2017)
In this study, the accuracy of different model approaches are compared - forecast data of 5 different raw weather models, forecast data calculated by the meteoblue Learning MultiModel (mLM) and model output statistics (MOS), and the reanalysis model ERA5. These forecasts have been verified against hourly measurements of more than 11'000 observation sites worldwide. The analysis was done for 2017, and partially for September - October 2018.
| Model approach | MAE [K] |
|---|---|
| meteoblue Learning MultiModel (mLM) | 1.2 K |
| Model output statistics (MOS) | 1.5 K |
| Reanalysis model ERA5 | 1.5 K |
| 5 different weather forecast models (RAW) | 1.7 - 2.2 K |
The following table shows the mean absolute error (MAE) in Kelvin for the different model approaches. The mLM approach demonstrated the lowest MAE, followed by the MOS and ERA5. These model approaches perform better than the raw models.
Furthermore, we can observe that the model performance typically decreases with increasing forecast hours (see figure below). The accuracy of the 2 m air temperature when using the mLM lies within 1.2 K for the 24-hour forecast, and within 2.0 K for the 6-day forecast. Based on the table above, this implies that the 24-hour forecast of the mLM is as good as the 6-day forecast of the raw model forecasts.
![MAE [K] as a function of the forecast hours for the mLM for single analysis days and the average (black).
The 24h forecast error for MOS (blue) and the raw models (red) is additionally shown.](/assets/images/graphics/mlm-and-raw-models.png)
The spatial distribution of the model errors (see maps below) highlights the fact that the mLM outperforms the best historical reanalysis model ERA5. In general, raw models such as GFS perform worse than model approaches based on post-processing methods in which local hourly measurements are considered.
![MAE [K] of the 2 m air temperature of the ERA5 reanalysis (not available as forecast) used for long term historical analysis.
Verification is based on all hourly data of the year 2017.](/assets/images/graphics/ERA5_MAE_page4.png)
![MAE [K] of the 2 m air temperature of the meteoblue Learning MultiModel (mLM)
used in operational weather forecast. Verification is based on all hourly data from September and October 2018.](/assets/images/graphics/mLM_MAE_page4.png)
![MAE [K] of the 2 m air temperature of the ‘stand-alone' model output as computed by GFS.
Verification is based on all hourly data of 2017.](/assets/images/graphics/GFS_MAE_page4.png)
Comparing different global models (2018)
An additional verification study to evaluate the performance of different global models was conducted in a separate bachelor thesis (Fessler, 2019). 24-hour 2 m air temperature forecast of the year 2018 of the forecast models NEMS, GFS05, MFGLOBAL, GEM and ICON were compared to hourly measurements of more than 8000 stations from the WMO (World Meteorological Organization) and GDAS (Global Data Assimilation System) from NOAA (National Oceanic and Atmospheric Administration), distributed worldwide. In addition to that, historical data of the reanalysis model ERA5 were included, in which several statistical error metrics were calculated and compared. Furthermore, the global patterns of accuracy variability were examined.
Raw model comparison
| Model | MAE [K] | MBE [K] |
|---|---|---|
| ERA5 | 1.5 | 0.2 |
| NEMSGLOBAL | 2.2 | 0.1 |
| GFS05 | 2.3 | 0.2 |
| MFGLOBAL | 2.3 | -0.1 |
| GEM | 2.4 | -0.7 |
| ICON | 2.0 | -0.1 |
Simple error comparison allows for the evaluation of the performance between different models. The following findings (see table below) confirm the previous study's results. The reanalysis model ERA5, with an MAE of 1.5 K, outperforms all raw models examined in this study, followed by ICON and NEMSGLOBAL. ERA5, NEMSGLOBAL and GFS05 tend to predict the temperature as higher than it actually occurs, while MFGLOBAL, GEM and ICON predict the temperature as lower than as described by hourly measurements.
Across all weather stations, ERA5 performs the best and has the lowest MAE (see figure below).
![MAE [K] for five numerical weather forecast models and one reanalysis model for the
entire year 2018 based on more than 8'000 WMO stations.](/assets/images/graphics/model_comparison_MAE.png)
Spatial Analysis
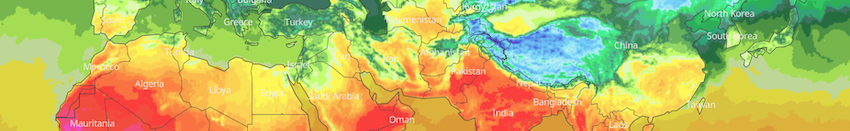
The spatial distribution of the MAE for the reanalysis model ERA5 and NEMS is visualised in the following world maps. To avoid overlapping of plot points from different stations, the globe was divided into model grid cells with a horizontal resolution of 2°. In other words, the MAE for all stations within one of the grid cells were first merged and then plotted in the center of the grid-field. The main distribution of the model error between both models is comparable, however note that NEMS has a shifted error range. In general, we can identify higher errors in the Rocky Mountains, India, China, and Eastern Russia. Good performance can be observed in northern Europe, North America, Australia, Western Russia, and Africa.
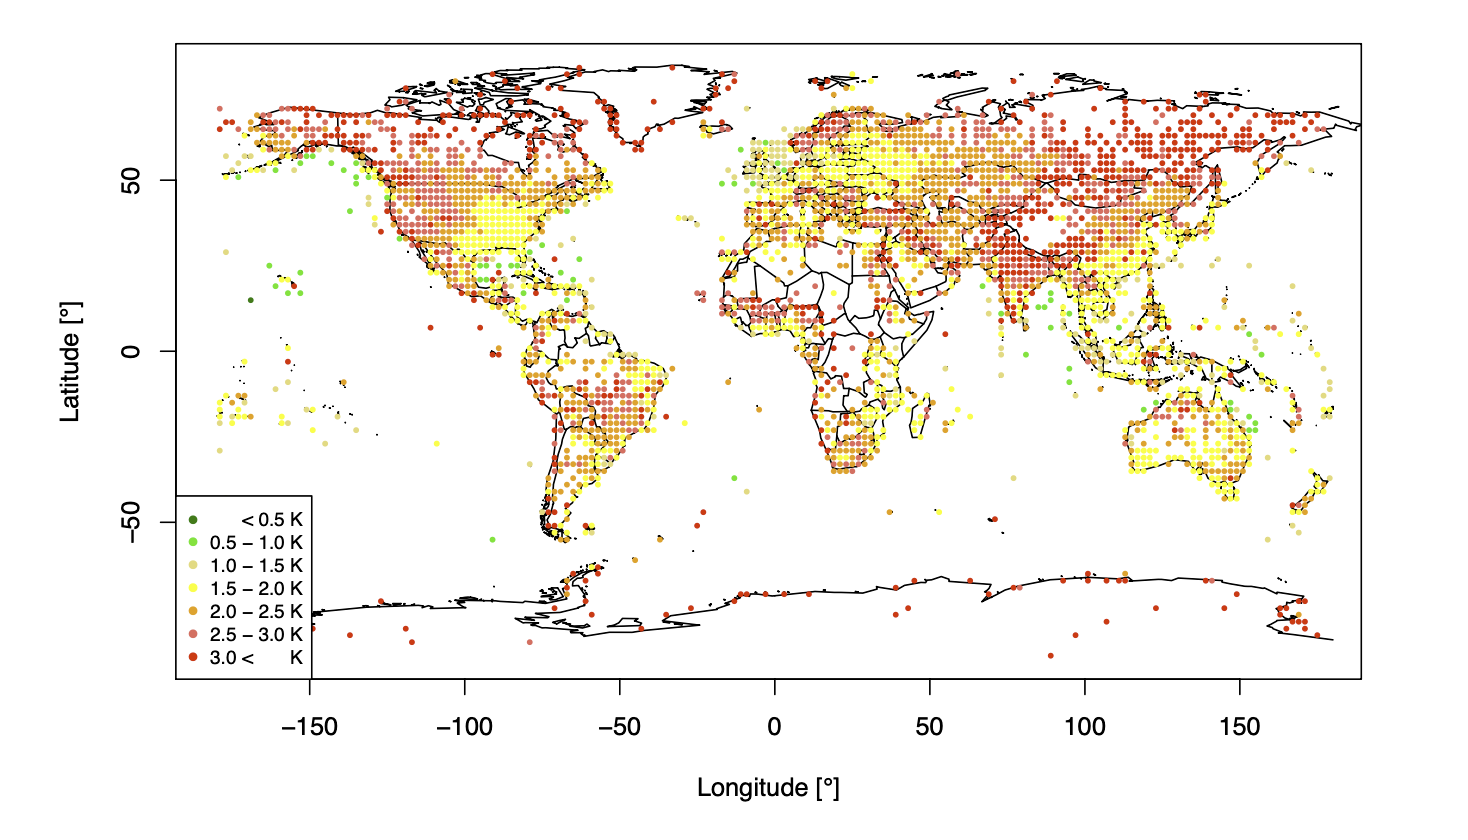
![Spatial distribution of the MAE [K] for NEMS (top) and ERA5 (bottom),
calculated for hourly measurements of the year 2018 of over 8000 weather stations worldwide.](/assets/images/graphics/worldmap-era5-page7.png)
The air temperature forecast has the highest accuracy on small oceanic islands and along ice-free coasts. In these regions, the air temperature is strongly influenced by the sea surface temperature. High accuracy and predictability over Europe and North America can be explained by the fact that weather forecast models were developed in these regions. Another fact worth mentioning (and not covered in the studies) is that air temperature is typically simulated worse in the northern hemispheric winter than in summer. Furthermore, the results show that the accuracy decreases in regions with complex topography such as the Rocky Mountains, the Himalayas, or the Andes, and with the increasing distance from the sea. Therefore, continental regions and regions with high elevation are typically simulated worse than maritime and low-elevated regions.
Provider comparison (2021)
In this study, the forecast performances of several weather providers were compared to the meteoblue forecast. The performances of these forecasts were verified with 475 METAR hourly measurements worldwide. For the analysis, the hourly 12 - 35h forecast created as 12:00 UTC was used. This verification was conducted for the year 2021. The following table shows that the meteoblue forecast lies within the top three performances, only slightly underestimating the air temperature.
| Provider | MAE [°C] | MBE [°C] | |
|---|---|---|---|
| 2 | meteoblue | 1.29 | -0.16 |
| 1 | Provider_D | 1.26 | -0.02 |
| 3 | Provider_F | 1.48 | -0.21 |
| Provider_C | 1.61 | -0.52 | |
| Provider_G | 1.73 | -0.03 | |
| Provider_B | 1.71 | -0.38 | |
| Provider_H | 2.03 | -0.23 |
The comparison of the MAE for different forecast time horizons (see table below) shows the typical decrease in forecast performance with increasing forecast hours (which was already mentioned in the section above). When it comes to the 12-hour forecast, meteoblue is the most accurate. meteoblue is the second accurate for the forecast days 1 to 3.
| Provider | Day 0 (0-11 h) |
Day 1 (12-35 h) |
Day 2 (36-47 h) |
Day 3 (48-71 h) |
||||
|---|---|---|---|---|---|---|---|---|
| meteoblue | 0.71 | 1 | 1.29 | 2 | 1.37 | 2 | 1.44 | 2 |
| Provider_D | 1.16 | 3 | 1.26 | 1 | 1.34 | 1 | 1.43 | 1 |
| Provider_A | 1.28 | 3 | 1.24 | - | - | |||
| Provider_F | 1.36 | 1.48 | 1.56 | 1.65 | ||||
| Provider_C | 1.54 | 1.61 | 1.68 | 1.92 | ||||
| Provider_G | 1.56 | 1.73 | 1.77 | - | ||||
| Provider_B | 1.68 | 1.71 | - | - | ||||
| Provider_H | 1.95 | 2.03 | 2.11 | 2.29 | ||||

