
Air quality
In this section you will find information about air quality, that is related to either pollution (e.g. air quality index) and/or other particles in the air (e.g. aerosol optical depth), which influence the clarity of the atmosphere.
Neither the European Commission nor ECMWF nor meteoblue is responsible for any use that may be made of the information presented here. Predictions are issued from an atmospheric model with 12 km resolution. Outputs may not be correlated enough with real concentrations. Please consult your local air quality agency, especially in the case of a pollution peak or a pollution alert.
Air quality index
The air quality index (dimensionless) indicates how clean or polluted the air is. Surface ozone, particulate matter, carbon monoxide, sulfur dioxide and nitrogen oxides are evaluated as pollution. A high index (>100) indicates a polluted air, combined with possible health hazards. Depending on how sensitive individuals react, the dangers can vary.
| Air quality index | Air pollution | Health implications |
|---|---|---|
| 0 to 50 | Excellent | No health implications |
| 51 to 100 | Good | Few hypersensitive individuals should reduce outdoor exercise |
| 101 to 150 | Lightly polluted | Slight irritations may occur, individuals with breathing or heart problems should reduce outdoor exercise |
| 151 to 200 | Moderately polluted | Some irritations may occur, individuals with breathing or heart problems should reduce outdoor exercise |
| 201 to 300 | Heavily polluted |
Healthy people will be noticeably affected. People with breathing or heart problems will experience reduced endurance in activities. These individuals and elders should remain indoors and restrict activities |
| 300+ | Severely polluted |
Healthy people will experience reduced endurance in activities. There may be strong irritations and symptoms and may trigger other illnesses. Elders and the sick should remain indoors and avoid exercise. Healthy individuals should avoid outdoor activities. |
Europe - CAQI Index
The Common Air Quality Index (CAQI) has been used in Europe since 2006. We are also using this standard for indicating air quality for other continents.
The CAQI is a number on a scale from 1 to 100, where a low value means good air quality and a high value means bad air quality. The index is defined in both hourly and daily versions, and separately near roads (a "roadside" or "traffic" index) or away from roads (a "background" index). meteoblue is showing the background index because weather models can not reproduce small-scale difference along the roads. Therefore, measurements along roads will show higher values.
Some of the key pollutant densities in μg/m3 for the hourly background index, the corresponding sub-indices, and five CAQI ranges and verbal descriptions are as follows.
| Qualitative name | Index or sub-index |
Pollutant (hourly) density in μg/m3 |
|||
|---|---|---|---|---|---|
| NO2 | PM10 | O3 | PM2,5 | ||
| Very low | 0-25 | 0-50 | 0-25 | 0-60 | 0-15 |
| Low | 25-50 | 50-100 | 25-50 | 60-120 | 15-30 |
| Medium | 50-75 | 100-200 | 50-90 | 120-180 | 30-55 |
| High | 75-100 | 200-400 | 90-180 | 180-240 | 55-110 |
| Very high | >100 | >400 | >180 | >240 | >110 |
Ozone concentration
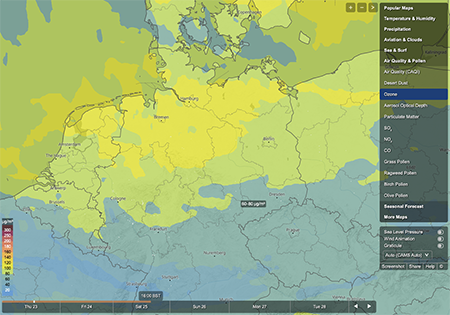
Ozone (O3) is a trace gas, which resides mainly in the stratosphere (90%) with a peak at an altitude of 25 km (ozone layer), where it absorbs the harmful solar UV radiation. The other 10% resides in the troposphere. Near the Earth's surface, ozone is a harmful pollutant, that can cause damage to the lung and other organs. Anthropogenic ozone pollution in the lower troposphere is caused mainly in urban areas where ozone is a result of photochemical reactions of nitrogen oxides and hydrogen carbons. The tropospheric ozone is unequally distributed and concentrations vary.
The ozone concentration is expressed in microgram per cubic meter (μg/m3) as well as in mole fraction (parts per billion, ppb) or Dobson Units (DU), which indicates the total-column ozone. Dobson Units show the theoretical thickness (in units of 10 µm) of the layer the gas would form, if it is set under standard temperature (0°C) and pressure (1013.25 hPa). For instance, 300 DU of ozone would form a layer 3 mm thick.
Ozone can be found at the surface but also very high up in the atmosphere. The upper air ozone in the stratosphere protects us from the very harmful UV-C and UV-B radiation. The lack of this stratospheric ozone is known as the ozone hole which can lead to severe health risks especially in the Southern hemisphere. For these reasons, a high ozone concentration in the stratosphere is positive, but near the surface it can be detrimental to human health. The meteoblue maps show the ozone concentration at the surface. Ozone in the air we breathe can harm our health, especially on hot sunny days when ozone can reach high concentrations. Even relatively low levels of ozone can cause health effects. Most at risk from breathing air containing ozone are people with asthma, children, older adults, and people who are active outdoors, especially outdoor workers.
Ozone can:
• Make it more difficult to breathe deeply and vigorously
• Cause shortness of breath, and
pain when taking a deep breath
• Cause coughing and sore or scratchy throat
• Inflame and damage the
airways
• Aggravate lung diseases such as asthma, emphysema, and chronic bronchitis
• Increase the
frequency of asthma attacks
• Make the lungs more susceptible to infection
• Continue to damage the
lungs even when the symptoms have disappeared
• Cause chronic obstructive pulmonary disease (COPD)
Pollen
Currently, we provide forecasts of Birch, Grass and Olive pollen. Birch pollen is one of the most common airborne
allergens during springtime, or later in the year in higher latitudes. As the trees bloom, they release tiny grains
of pollen that are scattered by the wind. A single birch tree can produce up to five million pollen grains. Pollen
is dispersed by air currents and can be transported over large distances. We thus show the pollen forecast overlayed
with the 10 m wind speed.
Grass pollen are the primary trigger of pollen allergies during the summer months.
It causes some of the most severe and difficult-to-treat symptoms. In humid climates, the grass pollen season can be
several months, in drier climates the grass pollen season is significantly shorter, as are the birch and olive
pollen season.
Precipitation can clean the air from pollen, but if it is associated with thunderstorms, the
strong winds initially increase the pollen concentration.
Desert dust concentration
The desert dust concentration indicates how much desert dust is contained in the air and it is given in six classes:
| Colour | Concentration |
|---|---|
| Green | < 40 μg/m³ |
| Light green | < 80 μg/m³ |
| Yellow | < 160 μg/m³ |
| Light orange | < 450 μg/m³ |
| Dark orange | < 1000 μg/m³ |
| Red | > 1000 μg/m³ |
At high concentration, desert dust can be perceived as a veil. The individual particles appear as condensation nuclei and lead to cloud formation.
PM10 and PM2,5
Atmospheric particulate matter (PM) are microscopic solid or liquid matter suspended in the air. Sources of particulate matter can be natural or anthropogenic.
Of greatest concern to public health are the particles small enough to be inhaled into the deepest parts of the lung. These particles are less than 10 microns in diameter (approximately 1/7th the thickness of the a human hair) and are known as PM10. They are among the most harmful of all air pollutants. Health problems begin as the body reacts to these foreign particles. PM10 can increase the number and severity of asthma attacks, cause or aggravate bronchitis and other lung diseases, and reduce the body's ability to fight infections.
Although particulate matter can cause health problems for everyone, certain people (the elderly, exercising adults, and those suffering from asthma or bronchitis) are especially vulnerable to PM10.
PM10 is a mixture of materials that can include smoke, soot, dust, salt, acids, and metals. Particulate matter also forms when gases emitted from motor vehicles and industry undergo chemical reactions in the atmosphere. PM10 is visible by eye as the haze that we think of as smog.
PM10 includes fine particulate matter known as PM2.5, which are fine particles with a diameter of 2.5 μm or less. The biggest impact of particulate air pollution on public health is understood to be from long-term exposure to PM2.5, which increases the age-specific mortality risk, particularly from cardiovascular causes.
SO2 (Sulfur Dioxide)
Sulfur dioxide is a gas, which is invisible and has a nasty, sharp smell. It reacts easily with other substances to form harmful compounds, such as sulfuric acid, sulfurous acid and sulfate particles. Short-term exposures to SO2 can harm the human respiratory system and make breathing difficult. Children, the elderly, and those who suffer from asthma are particularly sensitive to effects of SO2. SO2 and other sulfur oxides can contribute to acid rain which can harm sensitive ecosystems.
About 99% of the sulfur dioxide in air comes from human sources. The main source of sulfur dioxide in the air is industrial activity that processes materials that contain sulfur, eg the generation of electricity from coal, oil or gas that contains sulfur. Some mineral ores also contain sulfur, and sulfur dioxide is released when they are processed. In addition, industrial activities that burn fossil fuels containing sulfur can be important sources of sulfur dioxide.
Sulfur dioxide is also present in motor vehicle emissions, as the result of fuel combustion.
(Source: https://www.dcceew.gov.au/environment/protection/npi/resource/student/sulfur-dioxide-0)
CO (Carbon monoxide)
Carbon monoxide (CO) is a colourless, odorless, and tasteless gas that is slightly less dense than air. It is toxic to humans when encountered in concentrations above about 35 ppm, although it is also produced in normal animal metabolism in low quantities, and is thought to have some normal biological functions. In the atmosphere, it is spatially variable and short lived, having a role in the formation of ground-level ozone.
Carbon monoxide is present in small amounts in the atmosphere, chiefly as a product of volcanic activity but also from natural and man-made fires (such as forest and bushfires, burning of crop residues, and sugarcane fire-cleaning). The burning of fossil fuels also contributes to carbon monoxide production. Carbon monoxide occurs dissolved in molten volcanic rock at high pressures in the Earth's mantle. Because natural sources of carbon monoxide are so variable from year to year, it is extremely difficult to accurately measure natural emissions of the gas.
Carbon monoxide is a short-lived greenhouse gas and also has an indirect radiative forcing effect by elevating concentrations of methane and tropospheric ozone through chemical reactions with other atmospheric constituents (e.g., the hydroxyl radical, OH.) that would otherwise destroy them. Through natural processes in the atmosphere, it is eventually oxidised to carbon dioxide. Carbon monoxide is both short-lived in the atmosphere (on average about two months) and spatially variable in concentration.
NO2 (Nitrogen Dioxide)
Nitrogen dioxide is one of several nitrogen oxides. NO2 is an intermediate in the industrial synthesis of nitric acid, millions of tons of which are produced each year. At higher temperatures it is a reddish-brown gas that has a characteristic sharp, biting odor and is a prominent air pollutant.
The major source of nitrogen dioxide is the burning of fossil fuels: coal, oil and gas. Most of the nitrogen dioxide in cities comes from motor vehicle exhaust. NO2 is also introduced into the environment by natural causes, including entry from the stratosphere, bacterial respiration, volcanos, and lightning. These sources make NO2 a trace gas in the atmosphere of Earth, where it plays a role in absorbing sunlight and regulating the chemistry of the troposphere, especially in determining ozone concentrations.
Nitrogen dioxide is an important air pollutant because it contributes to the formation of ozone, which can have significant impacts on human health.
NO2:
- inflames the lining of the lungs, and it can reduce immunity to lung infections
- causes problems such as wheezing, coughing, colds, flu and bronchitis
Aerosol optical depth
The optical depth is a measure of how well electromagnetic waves can pass through a medium. Therefore, the aerosol optical depth is the measure for the reduction of light transmission caused by atmospheric aerosols. It describes the total light extinction in the vertical atmospheric column, which depends on the light's wavelength and the amount of atmospheric aerosols. The greater the value of optical depth, the greater the aerosol concentration. Sources of aerosol can be diverse: wild fire, desert dust or anthropogenic air pollution. The aerosol optical depth is dimensionless.
Visibility
Visibility is the distance at which an object can be clearly seen. Distances are expressed in metres (m). This value is given without any suspended particles.

