
Precipitation sums
The following is a summary of various studies based on precipitation sums. These include the verification studies from 2017 and 2019, the provider comparison analyses and additionally, the comparison of various models of the NEMS model family.
Global verification study 2017
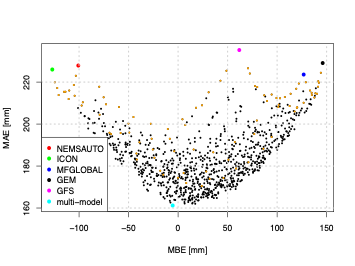
![MBE [mm] and MAE [mm] (top) and correlation coefficient (bottom) of the total annual precipitation 2017 for four ‘stand-alone' models (NEMSAUTO, ICON, MFGLOBAL, GEM, GFS)
and a combination of those four models (black dots). Model combinations with only two models were shown in orange.](/assets/images/graphics/mbecorrelation_two_columns_of_four.png)
Throughout this study, the meteoblue MultiModel was compared with other forecast models like ERA5, GFS, CHIRPS2 and NEMS. 6505 METAR precipitation measurements of the year 2017 (world widely distributed) were used to verify and compare the forecast of these models.
Results
The model performance of the total annual precipitation in 2017 can be significantly increased by combining two (or more) models of the forecast data set (see figures below). MFGLOBAL, GEM and GFS overestimate the total annual precipitation, whereas NEMSAUTO and ICON underestimate the total annual precipitation. A positive and negative bias of raw models could lead to a significant increase in the model performance by combining different models. More than 200 different model combinations represent a better global MBE than the best raw model (GFS). Also, they represent a better MAE than the best raw model (ICON). Hence, the systematic bias could be reduced to 0 and the MAE reduced to values below 170 mm. The correlation coefficient for the best model combinations is above 0.71 for the total annual precipitation, whereas the correlation coefficient of single raw models largely varies from 0.53 (GFS) to 0.67 (ICON). The best model performance is typically reached by combining more than two models. However, when combining more than two models, the performance of single events (e.g., daily precipitation > 1 mm) is typically decreasing. Therefore, we calculated the best model combinations with only two different models separately.
Global verification study 2019
Precipitation measurement data of 8112 WMO stations were compared to the 24h precipitation forecast of different models (ERA5, NEMSGLOBAL, GFS05, MFGLOBAL) for the year 2019 (Bachelor thesis Huonder, 2020). The following results refer to precipitation sums.
Thesis_Huonder_Verification_Of_Precipitation_Forecast_2020_DE.pdf (DE)
Results
The results from 2019 match very well with results from 2017, indicating that GFS and MFGLOBAL tend to overestimate yearly precipitation sums, whereas NEMSGLOBAL tend to underestimate yearly precipitation sums (Table below). The lowest MAE (hence the most accurate model) is the reanalysis model ERA5.
| MAE [mm] | MBE [mm] | MPE [%] | RMSE [mm] | SD [mm] | |
|---|---|---|---|---|---|
| ERA5 | 234 | -6 | -0.8 | 516 | 516 |
| GFS05 | 270 | 84 | 10.1 | 479 | 472 |
| MFGLOBAL | 281 | 131 | 15.8 | 469 | 450 |
| NEMSGLOBAL | 296 | -144 | -17.5 | 513 | 492 |
For the year 2019, a detailed precipitation verification for different months was conducted, indicating seasonal dependencies of the model accuracy of different models (Table below). For all months, ERA5 performs very well, with MPE constantly below 10%. The largest errors throughout the year were found for GFS and MFGLOBAL in the late northern hemispheric spring. The highest errors in NEMSGLOBAL were found in July and August, whereas the errors tend to be smaller in the northern hemispheric winter.
| Jan | Feb | Mar | Apr | May | Jun | Jul | Aug | Sep | Oct | Nov | Dec | |
|---|---|---|---|---|---|---|---|---|---|---|---|---|
| ERA5 | -6.5 | -2.5 | 0.2 | 2.6 | 2.5 | -0.4 | -2.5 | -3.7 | -0.6 | 3.1 | -0.7 | -0.9 |
| GFS | 5.0 | 6.0 | 10.1 | 12.5 | 15.0 | 13.6 | 13.3 | 8.7 | 9.1 | 8.6 | 10.0 | 7.3 |
| MF | 5.7 | 12.8 | 18.6 | 23.1 | 21.8 | 16.3 | 18.6 | 11.7 | 13.6 | 12.9 | 18.7 | 16.4 |
| NEMS | -11.6 | -12.6 | -12.4 | -11.9 | -13.9 | -23.0 | -15.3 | -28.6 | -20.4 | -17.0 | -13.6 | -11.2 |
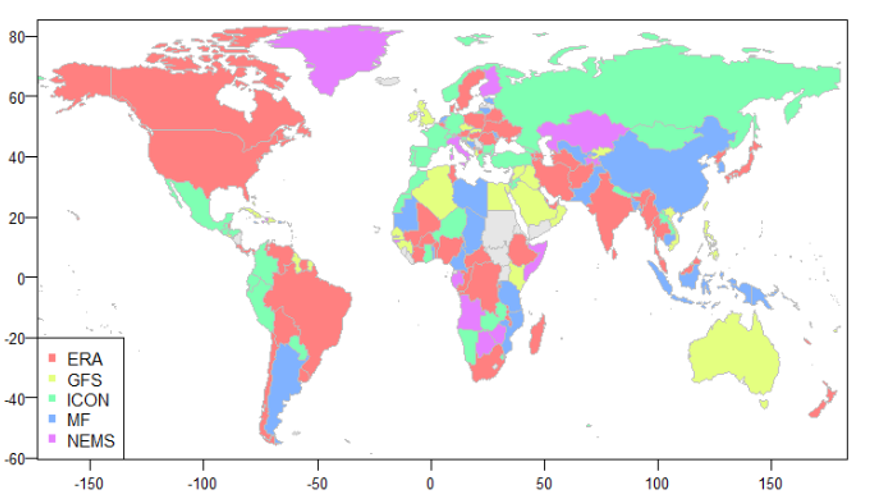
Finally, for each country, the best model performance for yearly precipitation sums was analyzed. The analysis shows that no clear patterns can be observed (Map below).
Competition analysis
The competition analysis between meteoblue forecast and different competitors allows us to evaluate the performance of our forecast in the market. 500 world wide distributed precipitation measurements from GSOD allowed a comparison of the forecast of precipitation sums for the whole year of 2021. Furthermore, the precipitation forecast error for 100 locations in North America was calculated through METAR measurements from January 2021 to July 2021.
Results
On average 362 mm over the 500 locations worldwide were recorded from GSOD (global summary of the day) for the first half of year 2021. The meteoblue forecast estimated 369mm for the 1 day forecast, which is equal to a mean bias error (MBE) = + 7 mm. The MAE for the same time period and locations is 135 mm.
In addition to that, the table below shows the errors in the precipitation sums for North America in the first half of 2021 for the meteoblue 24h precipitation forecast in comparison with 7 competitors.
Based on the updates on this study, on average 712.04 mm over the 500 locations worldwide were recorded from GSOD (global summary of the day) for the whole year 2021 and the meteoblue forecast estimated 720.46 mm for the 1 day forecast, which is equal to a mean bias error (MBE) = + 8.42 mm.
| Provider | MAE [mm] | MBE [mm] |
|---|---|---|
| Provider A | 38.67 | 29.42 |
| meteoblue AG | 42.01 | 33.37 |
| Provider B | 39.78 | -39.16 |
| Provider C | 36.00 | 25.95 |
| Provider D | 39.33 | 28.66 |
| Provider E | 45.99 | -45.99 |
| Provider F | 23.02 | -7.24 |
| Provider G | 201.08 | 200.91 |
NEMS verification
In addition to global weather forecast models, regional weather forecast models were additionally tested, to see potential improvements in the model performance by lowering the horizontal resolution in the model. Models of the NEMS family (NEMS12, NEMS4 and NEMSGLOBAL) were verified with data from 1605 measuring stations provided by GSOD and located in Europe for the first half of the year 2021.
Results
![MBE [mm] of NEMSGLOBAL, NEMS12 and NEMS4 for the first half year 2021 in Europe.](/assets/images/graphics/mbeprecipitation_lightbox.png)
The model performance slightly increases for daily precipitation sums, when using a regional model (NEMS12, NEMS4) instead of a global model (NEMSGLOBAL). However, the difference between NEMS4 and NEMS12 is not significant, rather NEMS12 performs better than NEMS4 (Figure below).
For 1644 stations in Europe, on average 314 mm precipitation were recorded by the weather stations for the first half of 2021. NEMS4 underestimated the precipitation amount by around 20%. (Average NEMS4 precipitation amount is 249 mm). The underestimation for the NEMS12 model is 14%, for the NEMS30 global model 25%. This implies that with decreasing horizontal resolution the model accuracy does not necessarily increase.

