
The strong but variable Bora
What is the Bora and why choosing it for an example of use of the archive data?
The Bora is a well-known North East wind that blows on the North Adriatic coast between Trieste and the Montenegrin coast. It is a cold and strong wind with gusts that can overpass 150 km/h.
The Bora is indeed strong but also variable: significant wind speed differences can be observed along the coast as well as off shore on the Adriatic. These differences create the so-called jets (area with strong winds) and wakes (area with weaker winds). These jets and wakes are mainly due to the coastal topography that conducts the Bora in particular directions. This effect has been well studied [1] and it is interesting to see how the meteoblue wind data can simulate it.
Why using simulation data to study the Bora?
The spatial variability of the Bora requires a high resolution data set. Weather stations cannot offer such a high resolution network. The two remaining possibilities are remote sensing methods (radar, satellites) and simulation from weather models. Radars require special equipments for the study area and therefore radar derived wind data cannot be obtained easily for any region and any period of time. Because wind simulations come from weather models that are operating globally over the world and that store data for a long period of time, they are more easily accessible.
What tools can we provide to study the Bora?
Wind maps might be the best way to visualise these jets and wakes patterns.
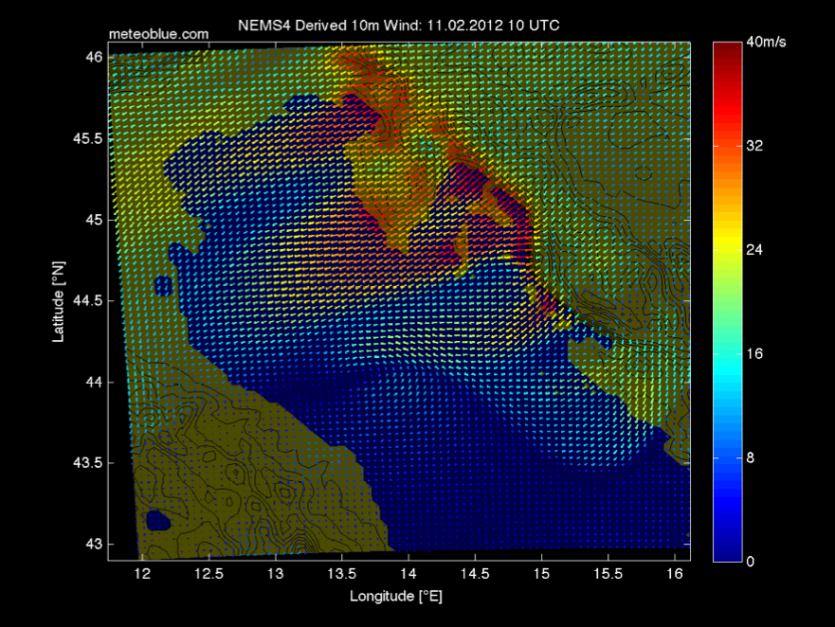
The figure below shows a wind map of the North Adriatic during a strong Bora event on 11th February 2012.
One can easily distinguish the area with strong winds reaching 40 m/s (144 km/h) followed by weaker winds of 20 m/s along the coast. This shows that our wind data simulate well the high spatial variability of the Bora.
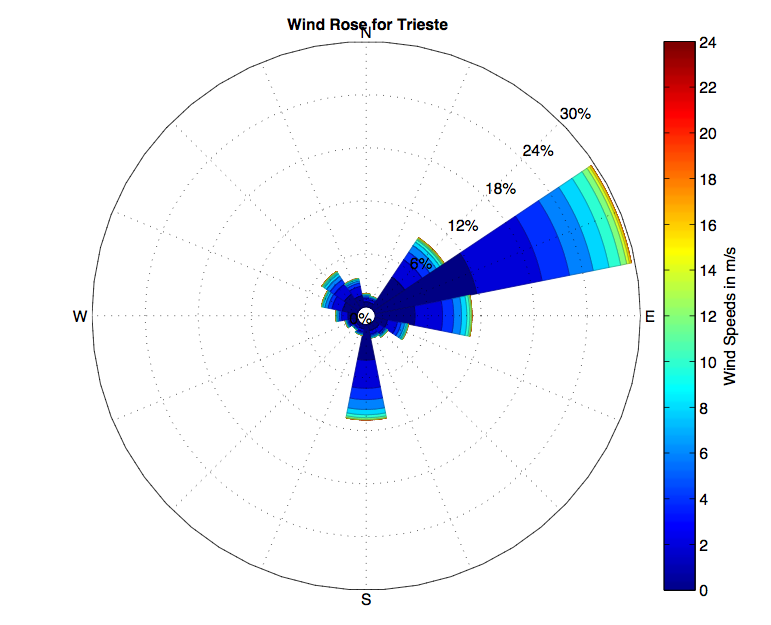
Wind roses are also a good way to see the wind speed and direction distribution for a specific region.
The figure below shows a wind rose for Trieste. One can see that 30% of the winds are coming from East North-East, which corresponds to the direction of the Bora. The south component represents another important wind of the region: the Sirocco.
We can also provide animations to see how the Bora evolves during the day. You can download such an animation here:
AnimationBora20120211.mov (4.91 MB)
Want More Details?
If you are more interested in this effect, you can download the full report here:
BoraStudy.pdf (2.47 MB)
The reliability of our wind simulations for this example is showed in the report. For general verification of our wind data, you can refer to our verification page.
What's next?
If you want to have the same kind of study for another area and another type of wind, you can contact us.
[1] Signell, R. P., J. Chiggiato, J. Horstmann, J.D. Doyle, J. Pullen and F. Askari (2010), High‐resolution mapping of Bora winds in the northern Adriatic Sea using synthetic aperture radar, Journal of Geophysical Research, 115, C04020, doi:10.1029/2009JC005524.

