
Meteogram MultiModel Ensemble
You can find the meteogram MultiModel Ensemble on the meteoblue website. The meteogram can be either displayed for 7 or 14 days.
A traditional ensemble (e.g. GFS) computed with the same forecast model often underestimates the uncertainties in the weather for the first 3 to 5 days thus overestimating the confidence in the forecast. Furthermore, the traditional ensemble is run at much lower resolution, thus neglecting some of the local weather phenomenon, which can be seen in high resolution models. It is very important to note, that all members of a traditional ensemble have the same likelihood of being true (there is no way to tell in advance which one will be better). This contrasts with the high-resolution models, where some deliver better forecasts than others depending on the location and weather conditions.
The blue lines correspond to the forecasts computed by different high-resolution weather models. Also shown are the members of a traditional ensemble prediction, where the same weather model (GFS) is run several times with slightly different initial conditions, to reflect uncertainties in the observations required to run a forecast model. The GFS members have been downscaled and bias corrected to match local weather conditions, data from the high-resolution models is untouched.
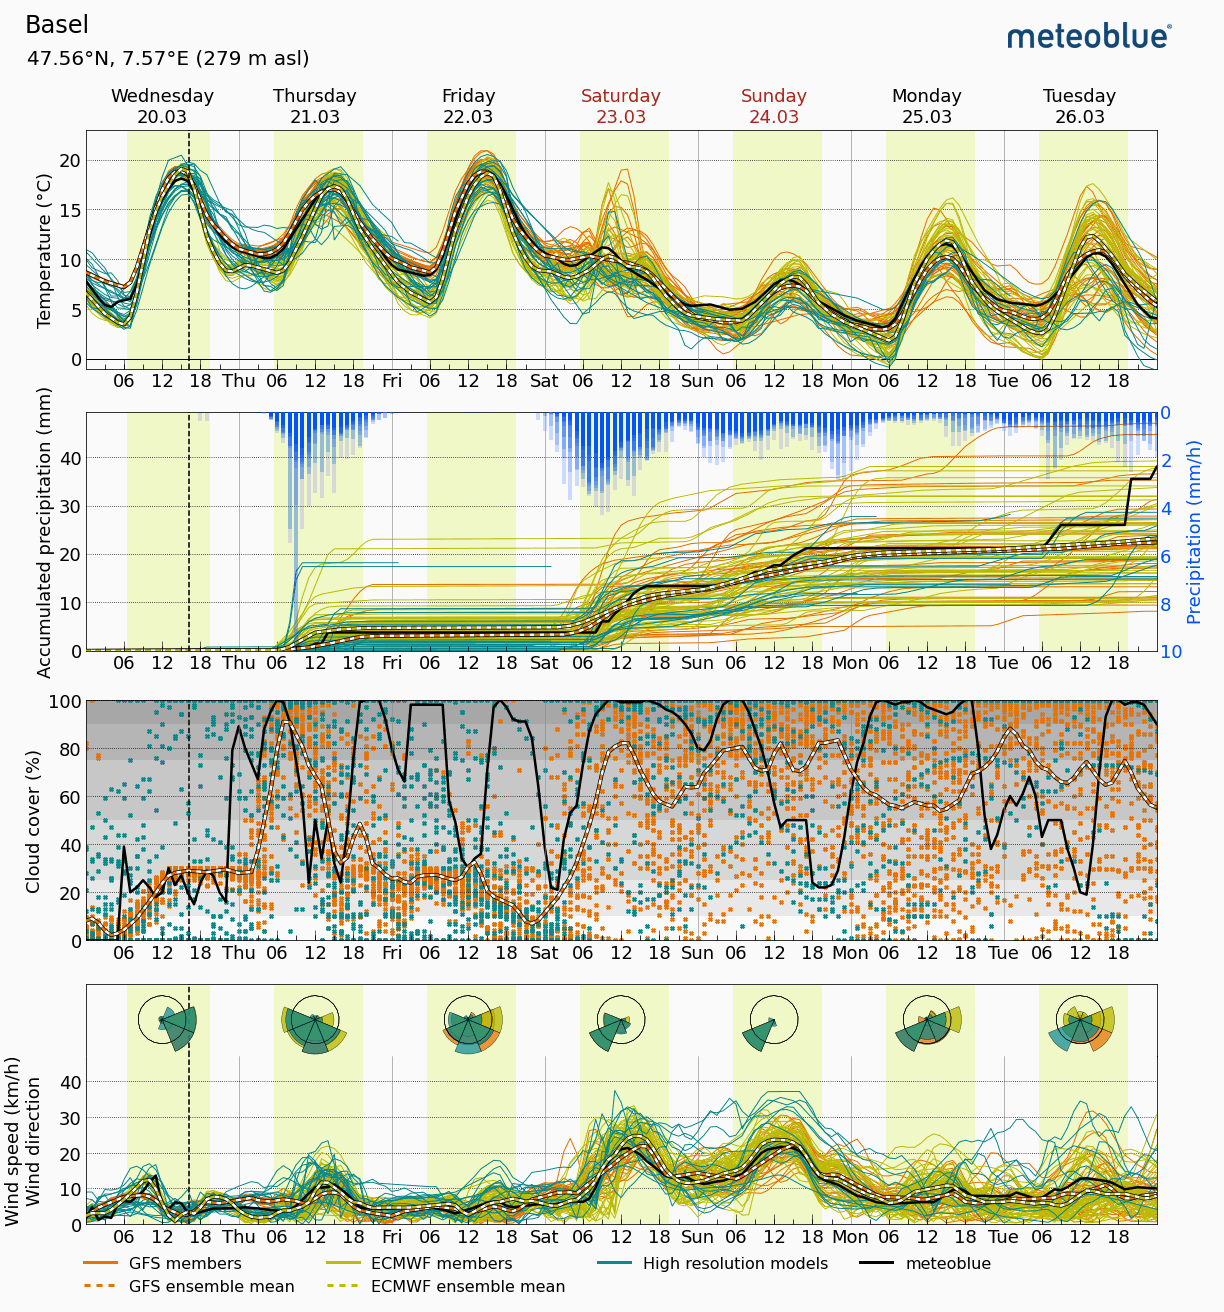
- In the top graph, the temperature forecast for Basel is shown using yellow for different high-resolution models and green for the GFS ensemble members. The black line represents the mean of all forecasts and the dashed line the meteoblue consensus forecast as shown in our weather forecasts.
- The 2nd graph shows the accumulated precipitation forecast, that is the total amount that falls from today up to the date shown on the time axis. Blue precipitation bars indicate hourly precipitation sums.
- The 3rd graph is forecast cloud cover in percent using light blue for the high-resolution weather models and green for the GFS ensemble members.
- The 4th graph indicates the wind forecast as computed by high resolution models (light blue) and by the ensemble prediction (green). Also shown is the daily wind direction summary in form of a wind rose. Larger segments indicate that this wind direction is more likely and more frequent over the day than directions having smaller segments. If you have many segments of all about equal size than the forecast of wind direction is very uncertain. If there are predominantly two opposing directions this often indicates a thermal wind circulation where wind blows from a different direction during the day than at night.
meteoblue weather models cover most populated areas at high resolution (3-10km) and world wide at moderate resolution (30km). For a single forecast, multiple weather models, statistical analysis, measurements, radar and satellite telemetry are considered and combined to generate the most probable weather forecast for any given location on Earth.
Weather models simulate physical processes. A weather model divides the world or a region into small grid-cells. Each cell is about 4km to 40km wide and 100m to 2km high. Our models contain 60 atmospheric layers and reach deep into the stratosphere at 10-25 hPa (60km altitude).
More information: weather modelling

