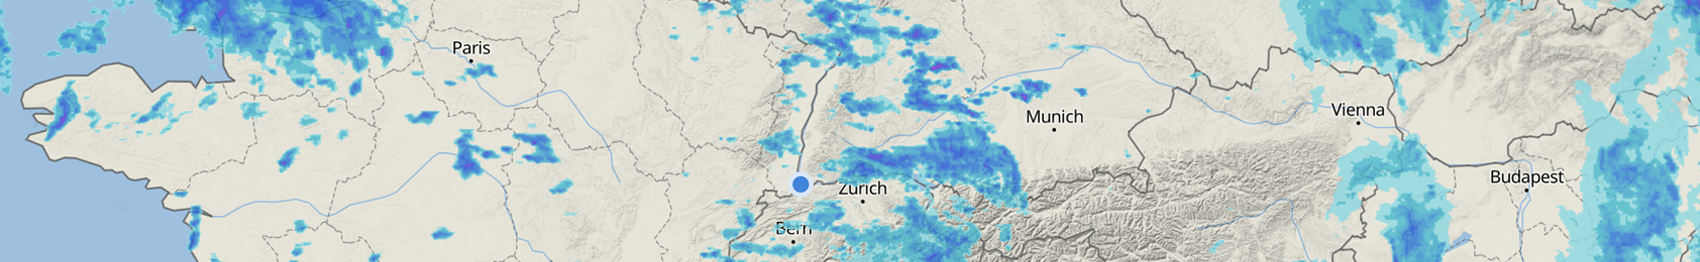
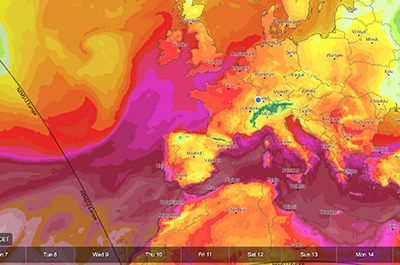
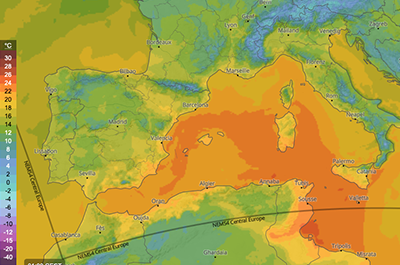
Temperature & Humidity
Apparent temperature
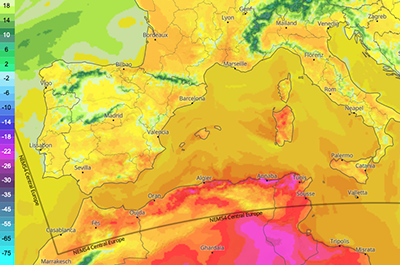
This map shows the apparent temperature, which corresponds to the temperature perceived by humans. It is composed of the heat index and the wind chill factor. The heat index calculates the temperature felt by a body when heat and humidity are combined. It rises with actual air temperature and relative humidity, which makes it increasingly difficult for the body to remove the excess heat through sweating. Exposure to direct sunlight can increase the heat index by up to 10°C. The wind chill factor describes the cooling effect of wind on the human perception of temperature.
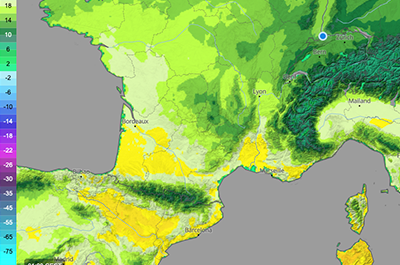
Freezing level height (0°C)
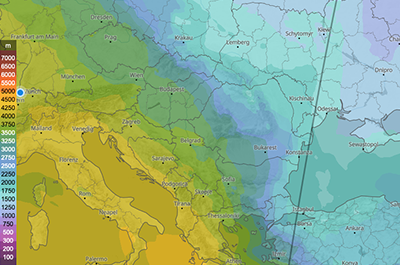
These maps show the altitude of the freezing level (zero-degree isotherm) in the free atmosphere, which is expressed in meters (m). In the menu you can choose between the average, the maximum and the hourly altitude of the freezing level. The freezing level height must not be confused with the rain-snow line. A good rule of thumb is that the the rain-snow line is roughly 300 m below the freezing level because it takes time to melt the ice crystals. The difference in elevation between the freezing level height and the rain-snow line depends on several factors such as the temperature gradient, the size of the ice crystals, and the humidity. For more information, see freezing level height.
Surface inversion
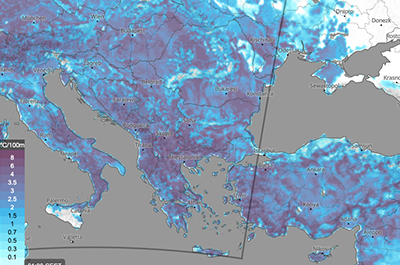
The map shows how the temperature changes from the earth's surface to an altitude of 100 meters (°C/100m). An inversion is a situation where the air temperature in the higher layers is warmer than in the lower layers of the atmosphere. Surface inversions are caused by the emission of long-wave radiation and the resulting cooling of the Earth's surface. They occur primarily during autumnal and winter high-pressure weather conditions, as the temperature is then particularly low and the lack of cloud cover favours night-time cooling.
Temperature change next (24h)
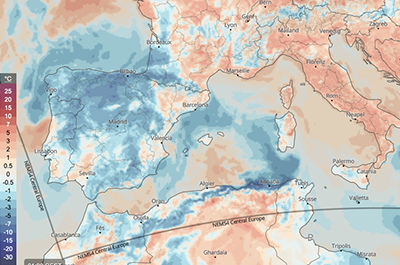
These maps show the change in temperature in the next 24 hours, expressed in degrees Celsius (°C) or Fahrenheit (F). Positive and negative values are possible as indicated in the map's legend. For more information, see temperatures.
Equivalent potential (ThetaE)
These maps show the equivalent potential temperature (Theta-e), which is expressed in degrees Celsius (°C) or Fahrenheit (F). The colours correspond to the normal temperature palette and are described in the map's legend. In the menu, the maps can be selected for different heights. The equivalent potential temperature (ThetaE) is the temperature a sample of air would have if all its moisture were condensed out by an adiabatic process and the sample then brought dry-adiabatically back to 1000 hPa. It is useful for identifying specific air masses and performing frontal analyses, for example. For more information, see temperatures.
Wetbulb potential temperature
These maps show the wet-bulb potential temperature (Theta-w), which is expressed in degrees Celsius (°C) or Fahrenheit (F). The colours correspond to the normal temperature palette and are described in the map's legend. The wet-bulb potential temperature is useful for identifying specific air masses and performing frontal analyses, for example. For more information, see temperatures.
Dew point temperature
These maps show the dew point temperature in degrees Celsius (°C). The colours are based on the normal temperature palette and are described in the colour bar. For more information, see dew point temperature.
Vapor pressure deficit
These maps show the vapor pressure deficit. Vapor pressure deficit (VPD) corresponds to the difference between the amount of moisture in the air and how much moisture the air can still absorb at a certain temperature until it is saturated. It is expressed as a pressure difference in hPa. The vapor pressure deficit is one of the most important factors influencing the transpiration of plants. A high VPD usually causes plants to close their stomata to minimise water loss and avoid embolism in the water conducting vessels. This occurs at the expense of reduced carbon uptake by photosynthesis. Therefore, VPD a limiting factor in plant growths.
Evapotranspiration
These maps show the evapotranspiration with colours as specified in the map's legend. The evapotranspiration is the sum of evaporation (soils, lakes, seas) and transpiration (plants). It assumes a non irrigated surface, thus only the naturally available water. Evapotranspiration is expressed in millimeters (mm). This value is an aggregation of conditions over larger areas and can not represent the specific conditions in a place, forest or field. It can be used to make regional comparisons and see gradients. For more information, see evapotranspiration.
FAO evapotranspiration (ET0)
This map shows the reference evapotranspiration (ET0) in milimeters (mm) according to FAO (Food and Agriculture Organization) standards. The values are calculated based on meteorological variables (radiation, temperature humidity, wind speed) for a well irrigated surface completely covered by crop. The term evapotranspiration describes the loss of water from a vegetated surface through the combined processes of plant transpiration and surface evaporation. This value is an aggregation of conditions over larger areas and can not represent the specific conditions in a place, forest or field. It can be used to make regional comparisons and see gradients. For more information, see soil and surface .
Potential evapotranspiration
These maps show the potential evapotranspiration with colours as specified in the map's legend. Potential evapotranspiration is a theoretical value and explains how much water would evaporate from a water surface. It is expressed in millimeters (mm). This value is an aggregation of conditions over larger areas and can not represent the specific conditions in a place, forest or field. It can be used to make regional comparisons and see gradients. For more information, see evapotranspiration.
Soil moisture
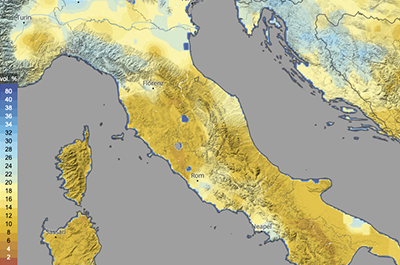
Soil moisture maps show the mean moisture of the topsoil in the area for specific depth range (e.g. 0-10 cm), indicated in % and visualised with colours as shown in the colour bar. This value is an aggregation of soil conditions over larger areas and can not represent the specific conditions in a place, forest or field. It can be used to make regional comparisons and see gradients. For more information, see soil moisture.
Soil temperature
Soil temperature maps show the mean temperature of the topsoil in the area for specific depth range (e.g. 0-10 cm), visualised with colours as shown in the colour bar. This value is an aggregation of soil conditions over larger areas and can not represent the specific conditions in a place, forest or field. It can be used to make regional comparisons and see gradients.

