
Predictability
Display
Predictability is the estimated certainty of our forecast. It considers uncertainties in pressure, precipitation, temperature, wind, as well as larger scale patterns and climate inconsistencies. The forecast achieves a high and constant predictability in high pressure areas and locations with low weather variance (like deserts). Predictability is lower in low pressure situations, with storms, intense precipitation events or with thunderstorms. Our goal is to show you that some weather events are not so easy to predict and that some forecasts might yet be inaccurate or may change completely within the next 12 hours.
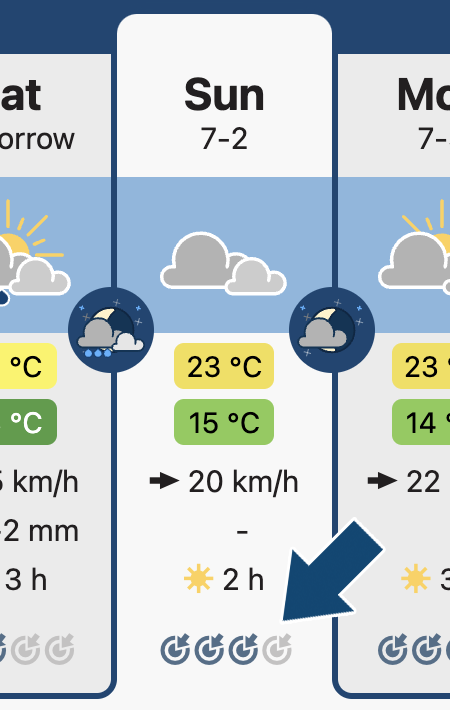
Predictability is displayed as a set of icons on the 7-Day Weather overview, and as partially filled, colour-coded bars on the 14-Day Weather meteogram. These can be interpreted as follows:
| 80-100% | Reliable forecast, very unlikely to change | |
| 60-80% | Fairly reliable forecast, unlikely to change | |
| 40-60% | Somewhat uncertain forecast, changes possible | |
| 20-40% | Fairly uncertain forecast, likely to change | |
| 0-20% | Uncertain forecast, very likely to change |
Interpretation
In the case of a low or very low predictability, decisions should not be based on (or be independent of) weather conditions. Decisions depending on weather conditions should only be taken into account if predictability is high or very high. Should an important decision have to be made with medium or low predictability levels, then precautions for changes in weather should be taken, as i.e. shown in Ensemble Forecasting and in the 14-days forecast.
For certain weather conditions such as thunderstorms, predictability will not become better than moderate. The explanation is that, even though thunderstorms can be predicted with high probability, the development, course and expression of a thunderstorm can not be very well predicted; therefore, large differences between predicted and actual temperatures, wind speeds and precipitation amounts can be expected: these differences mean that the predictability of the weather variables used for weather description must be lower.
Forecast with predictability = 10% will change with a probability of 90%.
Forecast with predictability = 25%
will change with a probability of 75%.
Forecast with predictability = 90% will change with a probability of
10%.
etc.
This probability applies to all weather variables. In a forecast with 90% accuracy, all variables change with a 10% probability, or 4 out of 5 variables do not change with a 100% probability, and a variable (e.g., precipitation) changes with a 50% probability. This adds up to a large number of variables, but ultimately it is not that important in detail. Mostly, predictability affects the most important variables such as temperature, wind speed, sunshine, precipitation and thunderstorms (lightning).
Predictability is calculated for areas of 50x50 km (if not otherwise indicated), downscaled with special methods and for weather variables, which can be measured. For complex phenomena, such as thunderstorms, a numerical "thunderstorm probability" can not be calculated, because the numerical definition of "thunderstorm" is unclear: thunderstorms consist of lighting (ground and cloud), rainfall, wind gusts and eventually hail, most of which can not be precisely measured. Hence, the numerical definition is not precise enough to make a "thunderstorm probability" percentage index.
Decision support
"Predictability" is actually an important weather variable for decision making (a "decision support"). It may seem surprising that predictability can sometimes be better to 4 days ahead than for 48 or 24 hours ahead. This is, however, not a paradox. For example: When the weather conditions change, for example from depression to high pressure or vice versa (i.e. from "bad" to "good" or from "good" to "bad"), often this occurs with a frontal passage (warm or cold front), which implies a rupture in the mass of air, and in this rupture typically the adverse conditions (e.g. thunderstorms) concentrate. It is not always easy to know, when this front will arrive (timing) and what will be it's activity (nature, intensity, duration of rainfall), even in the short term. Such transitions can therefore complicate forecasts in some cases. On the other hand, in the same context, once a high pressure zone has established (or a depression, which is nearly symmetric), it is quite certain that weather will be fine (or bad) for at least 4 or 5 days or more. During the day of the front passage, the predictability will be lower than before or after the passage.
Because of possible uncertainties, we thus indicate two forecast-probabilities in our forecast information:
1. Predictability: The calculated probability
of occurrence of the forecasted weather for the entire day and for all weather variables.
2. Precipitation probability: The probability
of the occurrence of precipitations.
Examples
It is true that a change in probability from one day to the other is difficult to understand, so here are some
examples to help with understanding:
1. Weather examples:
1.1. Example 1. Predictability for next
Saturday is low, due to a storm that will approach (according to the current forecast). A day later, the forecast
changes, indicating that the storm will arrive on Friday, lowering the predictability for Friday and increasing the
predictability for Saturday.
1.2. Example 2. Predictability is high for Saturday (according to the current
forecast). A day later, there are thunderstorms in the forecast for Saturday, lowering predictability for Saturday.
- If a high predictability predicted initially could not be lowered, we could not show these phenomena after they appear in the forecast, because they will lower a previously high predictability. However, it is not possible to predict these phenomena and 7 to 14 days in advance.
- If we keep predictability always low, we could not be able to show days with stable weather in advance, because we would have to maintain the option for a change that reduces predictability.
- Finally, if we knew in advance that such a change will happen, we would not need predictability, because the sequence of things would already be known.
2. A second approach to understanding is to take an example from real life, such as an insurance: If you buy
insurance, you are estimating a probability, say 5%, that damage will occur. This does not mean that it will happen,
and it may never happen. When it occurs, it will have a 100% chance of occurrence.
This means, that a
predictability can change over time, both upwards or downwards.
3. A third approach is that of progression over time: With each passing day, predictability of the forecast will
tend to be better.
It's like in football: a team may be a champion, but they will not always win. However, it
will loose much less frequently than a team with low ranking...
Likewise, a predictability may be high, but
even so, the forecast for some days with high predictability will still be wrong - but less frequently than for days
with low predictability.
4. Another approach to understanding is certainty: If we knew the exact predictability beforehand, we would not have to show a percentage, and we could immediately show the exact sequence of events.
Since weather is at least partly chaotic, and thus can not be calculated nor measured with 100% accuracy, we offer these probabilities as a tool for the user to better understand weather. A process for risk management can be found by clicking here.
Important note
For activities that are associated with risk to life and limb, such as mountain tours, sailing, paragliding and others, a competent meteorological assessment of the situation on-site must always be made. The predictability is NOT a substitute for a professional assessment of the situation on-site, and can only support this assessment!
If you have questions or suggestions, please contact us.

