
Spraying Window
This Meteogram Spraying Window indicates the most suitable times for spraying your crops. You can see the time values per se, as well as the anticipated temperature, precipitation, and wind data.
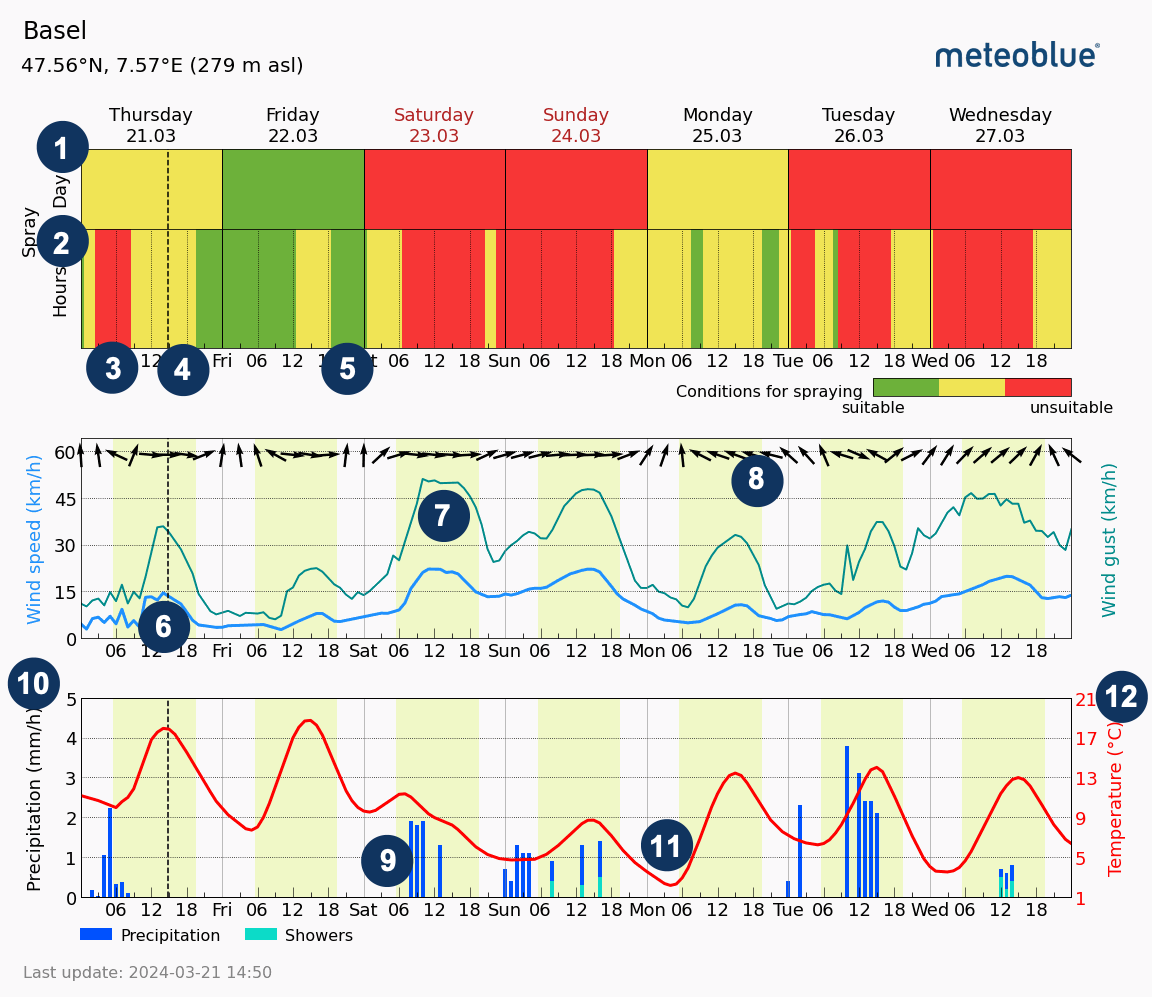
The topmost part of this meteogram displays the suitability of crop spraying on a particular day (1), and in 6h intervals within each day (2). Red colour indicates unsuitable conditions (3), yellow stands for less suitable (4), and green means suitable (5).
The middle part of the meteogram shows wind conditions. The light blue curve (6) shows wind speed and the dark green curve (7) indicates the speed of wind gusts. The units are displayed on both sides of the meteogram. The wind barbs (8) at the top imply the wind direction.
The bottom part displays the precipitation forecast in blue columns (9), with units on the left (10), as well as the air temperature (11) denoted by a red curve, with the units on the right-hand side (12).

