
Wind
Wind is the motion of air in a direction with a certain speed. Officially, wind is measured at 10 meters above ground. In practice, many other measurements heigths (1, 2, 20, 50, 80 meters above ground, 900 mb etc) are possible. Our simulations show wind (in the same way as official measurements) at 10 meters above ground, unless otherwise mentioned.
Examples of wind descriptions are shown in the meteograms and pictocast, as well as under the and wind maps.
Wind direction
The wind direction is defined as the direction from which the wind blows, e. g. the north wind comes from the North and blows to the South. However, if the wind direction is represented by an arrow, the arrowhead points to the direction to which the wind blows. In meteorology, it is common to use wind barbs , to show the wind direction along with the wind speed. The part of the barb with the feather(s) attached points in the direction from which the wind comes.
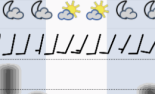
The images show two different presentations of the same wind: it is South wind, since it comes from southern directions and blows northward.
Wind gusts
Wind gusts indicate how turbulent the wind is. They describe the maximal speed that can be expected for short periods of time, which can vary enormously and be much higher than the wind speed, which is defined as mean wind speed (usually per hour or day).
Gust wind is defined (by WMO) as “Maximum value, over the observing cycle, of the 3-second running average wind speed“ and measured in meters per second (m/s), kilometres per hour (km/h), miles per hour (mph), knots (kn) or Beaufort (bf), usually for 10 or 80 meters above ground. Since wind gusts are turbulent, it is not possible to precisely define the direction of the gusts, as it may vary randomly.
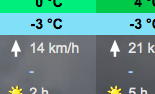
In our daily website overview, we display the range of wind speeds for the day. The lower number indicates the average expected wind speed, while the higher number indicates the wind gusts.
Wind speeds can differ greatly from the gusts, in extreme cases by a factor of several times (4-10 x). This can be described by the example of a transitory thunderstorm: even if the average wind speed on that day is e.g. 10 km/h, the thunderstorm can pass with wind gusts of e.g. over 80 km/h and more, which may last only for a few minutes.
Wind measurement units
| Beaufort (Bft) | Wind km/h | Wind knots |
|---|---|---|
| 0 | 1 | 1 |
| 1 | 1-5 | 1-3 |
| 2 | 6-11 | 4-6 |
| 3 | 12-19 | 7-10 |
| 4 | 20-28 | 11-15 |
| 5 | 29-38 | 16-21 |
| 6 | 39-49 | 22-27 |
| 7 | 50-61 | 28-33 |
| 8 | 62-74 | 34-40 |
| 9 | 75-88 | 41-47 |
| 10 | 89-102 | 48-55 |
| 11 | 103-117 | 56-63 |
| 12 | 118-133 | 64-71 |
Wind directions are given in North (N), South (S), East (E) and West (W), or in North azimuth degrees (0-360°) [number codes for data feeds in square brackets], with:
- 0° = North (North wind) [5]
- 45° = Northeast (Northeast wind) [6]
- 90° = East (East wind) [7]
- 135° = Southeast (Southeast wind) [8]
- 180° = South (South wind) [1]
- 225° = Southwest (Southwest wind) [2]
- 270° = West (West wind) [3]
- 315° = Northwest (Northwest wind) [4]
- 360° = North [5]
For wind speed, there are different measuring units:
- kilometres per hour (km/h): 1 km/h = 0.27778 m/s
- metres per second (m/s): 1 m/s = 3.6 km/h
- knots (kn): 1 kn = 1.852 km/h
- Beaufort (see table on the right)
More general information can be found on UCAR.
Wind measurement
Standard measurements as well as model forecast output is shown as:
- Wind speed
- average of all wind speeds calculated for each model interval of the previous hour
- Wind gusts
- highest wind speed of all calculated for each model interval of the previous hour
Wind speed is measured in the same way as it is calculated in the simulation. Wind gusts are measured differently by weather
services. Some report gusts are the average of 10 measurements per second, others of 2 measurements per second, some
as the highest speed measured at any moment during a certain period.
Turbulence of the air increases with the
difference between wind speed and wind gusts in absolute terms (km/h or others).
Wind scale
Below, you find two files with information about wind strengths in different units (Beaufort, km/h, m/s, knots), descriptions of the wind and of its effects at land and sea.
Windtable_Land_EN.pdf (128.38 kB)
Windtable_Water_EN.pdf (2.82 MB)
Wind symbols (wind barbs)
Wind symbols represent the speed and direction of the wind for a time period referenced in the presentation (clima, past , now or next).
Wind symbols are used hourly, or for time periods of a date (0-24 o'clock), day and night (as determined by sunrise and sunset), and day periods (morning, afternoon, evening, night). When used hourly, the symbol applies for the indicated hour. When used for intervals, they represent averages, maxima or minima of the indicated range.
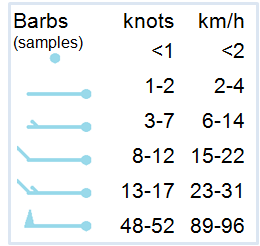
In the image on the side, you find examples of wind barbs used in the meteoblue meteograms and some maps.
The symbol collection is an overview of the International Convention for representing wind direction and speed with a symbol.
| Symbols | Wind Speed in Knots | Wind Speed in km/h |
|---|---|---|
 |
0 | 0-1 |
 |
1-5 | 2-9 |
 |
6-10 | 10-19 |
 |
11-15 | 20-28 |
 |
16-20 | 29-37 |
 |
21-25 | 38-46 |
 |
26-30 | 47-56 |
 |
31-35 | 57-65 |
 |
36-40 | 66-74 |
 |
41-45 | 75-83 |
 |
46-50 | 84-93 |
 |
51-55 | 94-102 |
 |
56-60 | 103-111 |
| Symbols | Wind Speed in knots | Wind speed in km/h |
|---|---|---|
 |
61-65 | 112-120 |
 |
66-70 | 121-130 |
 |
71-75 | 131-139 |
 |
76-80 | 140-149 |
 |
81-85 | 150-157 |
 |
86-90 | 158-167 |
 |
91-95 | 168-176 |
 |
96-100 | 177-185 |
 |
101-105 | 186-194 |
 |
106-110 | 195-204 |
 |
111-115 | 205-213 |
 |
116-120 | 214-222 |
 |
121-125 | 223-231 |
A clarification concerning the barbules attached to the wind arrows: in addition to indicating the force of the
wind, they should indicate the relative position of the low pressure zones, and therefore be positioned on the left
in the Northern hemisphere and on the right in the Southern hemisphere.
On our website, we only use the
presentation of the Northern hemisphere, because these locations are used much more frequently, and because detailed
graphs with many wind barbules, such as the air meteogram,
will get too busy (and difficult to read) when changing the direction of the wind barbules between graphs; or even
within one graph, such as for the Cross-Section.

