
Sowing Windows
The Meteogram Sowing Windows combines relevant weather variables from which the suitability of the weather conditions for sowing various crops is derived. The concise visualisation offers immediate insights into the weather situation, simplifying the decision-making for agricultural endeavours.
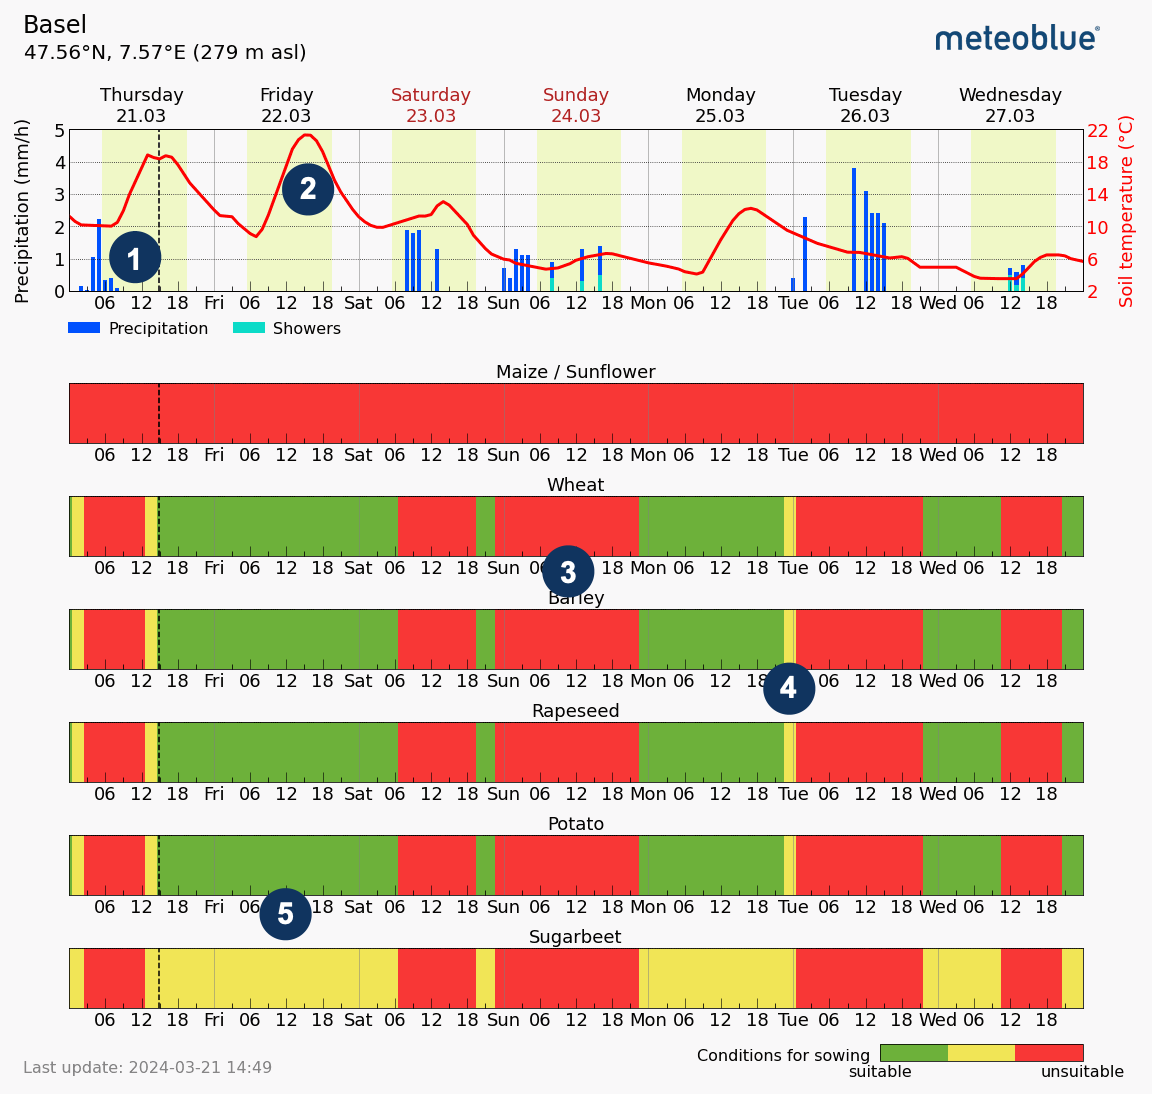
The top part of the meteogram displays the precipitation in blue columns (1), and soil temperature by the red curve (2). The units are indicated on the left and right in the respective colours. Below, you can find 6 diagrams pertaining to select crops: maize /sunflower, wheat, barley, rapeseed, potato, and sugar beets. The suitability of sowing / planting is indicated by colours - red (3) indicates unsuitable, yellow (4) less suitable, and green (5) means suitable.

