
SPOT® - The local overview (my surrounding)
meteoblue SPOT® is a local overview of the "region". It offers a bird's-eye view on the weather for your
place.
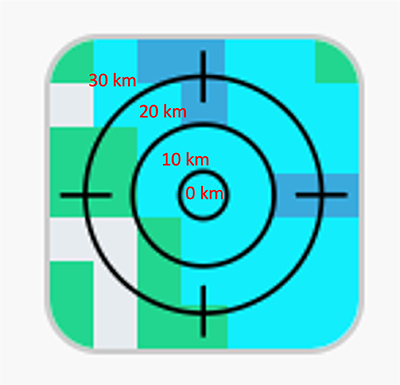
SPOT® diagrams show weather events in the area surrounding the selected location, like precipitation in rainNOW and rainSPOT. The size of the area covered by SPOT® is shown
in the legend. SPOT® colour levels show the intensity for the different events displayed on the different
SPOT® features, like precipitation, cloud cover, or others.
The meteoblue SPOT® shows a square of several grid cells , with the selected location in the central cell. The exact position of the location may not be always in the exact center of the grid cell, but the difference will be at most a few kilometres away from the center of the SPOT®. Thereby, you are always in the center or near to the center - no matter which location you select, even in the mountains or the sea. The meteoblue system with global coverage allows you to find a regional view for any place in the world. The radius of the outside circle is indicated on the left of the SPOT®, following the model resolution.
With SPOT®, you can distinguish a thunderstorm (local) from a rainfront (whole area), or a band of showers
(mixed distribution). If you know the area, you will see the effect of topography, wind direction or other weather
developments in your SPOT® diagram.
Thereby you can spot what is expected in the neighbourhood,
what risks are approaching, and how regional patterns develop.
How does SPOT® work?
SPOT® uses meteoblue Surrounding Place Overview Technology. The meteoblue system looks for the area surrounding the selected place, and instantly classifies the weather data into groups according to the legend.
SPOT® requires data from the entire area surrounding the selected place, a very rapid system for data extraction and processing, and a simple visualisation. This combination is a unique product of meteoblue since 2008, becoming the first meteorological service of the world to introduce this form of weather presentation.
Technical documentation for SPOT®
The SPOT® information can be obtained as data, via the meteoblue API. See technical documentation.

