
Precipitation
Precipitation is the deposition of water on the Earth's surface in the form of rain, snow, ice or hail.
We provide our best high-resolution precipitation forecast in the point meteograms, pictocast, rainSPOT and on the maps, offering precise forecast data on precipitation amount and type in a variety of units.
Further presentations and scales can be supplied on request.
Forms
meteoblue forecasts precipitation of the following forms:
- rain (liquid)
- snow (crystals)
- ice (frozen water), ice rain, freezing rain
- dew (condensation on surfaces), for Agro services
Other precipitation types, such as hail (solid ice) can be calculated for special services.
Types
Precipitation can categorised into three types:
- Convective precipitation falls as showers with rapidly changing intensity, and over a certain area for a relatively short time, as convective clouds have limited horizontal extent.
- Orographic precipitation falls when masses of air pushed by wind are forced up the side of elevated land formations, such as large mountains.
- Stratiform precipitation caused by frontal systems (mainly of cold air) that usually bring rain distributed in a uniform way over a larger area.
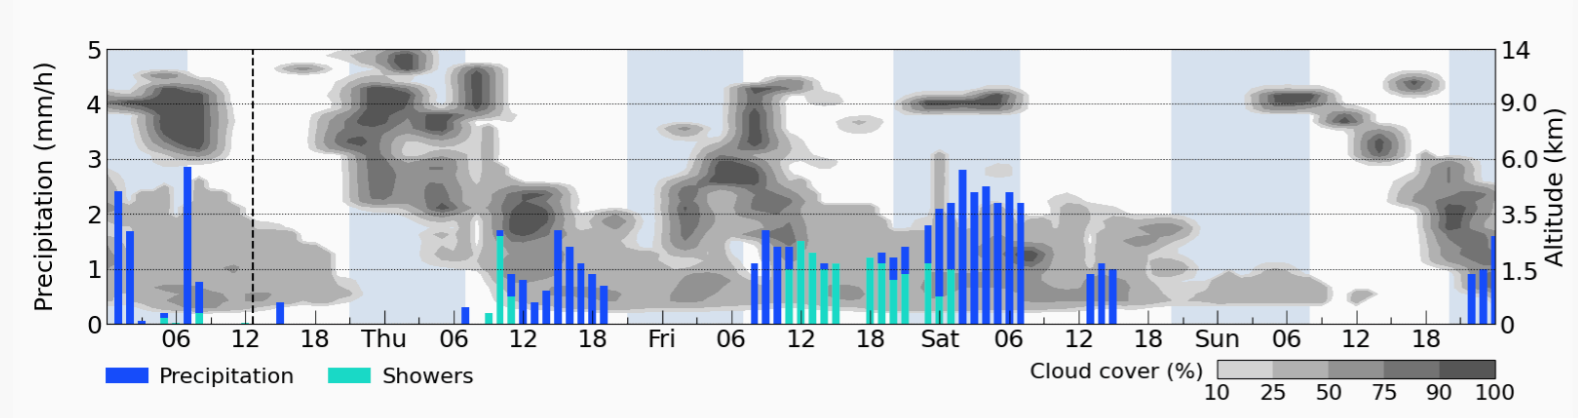
In the meteograms, precipitation is divided into showers (includes both convective and orographic precipitation) in light blue, and in total precipitation (by adding stratiform precipitation) in dark blue (see figure below). Convective precipitation is likely to be more erratic and unevenly distributed than stratiform precipitation. That leads to a higher variability of actual quantities, spatial distribution and probabilities for convective precipitation than for stratiform precipitation.
Snowfall is indicated as an asterisk (*) and freezing rain as an exclamation point (!) on the corresponding bar. Hail is only displayed for special services. If precipitation falls as snow, the snow cover can, if not indicated, be calculated by multiplying the quantity of water by the factor 10.
When temperatures are above 3°C (approximately), precipitation usually falls as rainfall. For the formation of snowflakes, the atmosphere level in which they form (approximately 0.5 to 5 km above ground) must be below 0°C. At ground, where the temperature is usually higher than above, snowflakes can remain until slightly above zero degrees. If the temperature exceeds this threshold, snowflakes will melt before reaching the ground.
In some cases (e.g., warm fronts), warm moist air flows over cold air. In the layer above, the original precipitation forms as rain, which then turns into snow on the way down as it reaches the cold air layer. If there is a thick, sub-freezing layer of air near ground-level, the raindrops are supercooled while passing through. Whenever they hit surfaces (such as the ground, trees, electrical wires, aircrafts or automobiles), they automatically freeze. This results in an ice layer, also called black ice, sometimes accumulating to a thickness of several centimetres.
Assessing precipitation quantity
Precipitation can be quantified in different units: For liquid precipitation, millimetre, centimetre, inches or litre per square metre are used, where 1 millimetre corresponds to 1 litre of water per square metre. Precipitation in form of snow is expressed in centimetres or inches. One millimetre of rain corresponds to 10 millimetres of snow, depending on the snowflake conditions. However, fresh cover thickness is being reduced over time by deposition and compaction.
Our meteoblue precipitation forecast presents liquid precipitation in mm or inches for the displayed time period (day or hours), and solid precipitation (snow) in mm of water equivalence (WE), cm or inch of height for a given time. Forecast precipitation quantity is always displayed for a certain time interval, such as millimetres/inches per hour. The indicated amount is always valid for the period preceding the given time. For example, the 3-hourly precipitation sum shown for 12:00 UTC includes the total quantity of rain between 9:00 UTC and 12:00 UTC.
Precipitation quantity values from simulations are valid for the the area of a grid cell, e.g. 10x10 km. The following scenarios would all be displayed in the same way:
- 10 mm distributed uniformly across 10x10 km
- 20 mm in 50% of the area of 10x10 km
- 100 mm in 10% of the area of 10x10 km
- any other combination adding up to a quantity of 10 mm over 10x10 km
The three main methods for measuring precipitation are as follows:
- Local weather stations: with pluviometre ("raingauges", "snowgauges")
- Tele-detection: using reflection of radar, the distribution of precipitation in the atmosphere is calculated
- Local indirect observation: using bowls, surface cavities, surface runoff or flood gauges
meteoblue uses precipitation measurements based on WMO standards to validate the precipitation forecast. For more information, see the weather data accuracy page.
Probability
Precipitation probability (as well as some other parameters) are calculated from an ensemble of 20 model runs. The probability is the frequency with which precipitation occurs in these 20 different forecast calculations. This calculation is usually made for an area (grid cell) of 50x50 km, meaning that the precipitation probability is displayed for a larger area than that which the actual precipitation amounts are calculated for (< 50 km). This may lead to inconsistencies, where a high quantity of precipitation is predicted for certain locations despite a low precipitation probability indication, or the other way around. Further details are provided under interpretation (below).
Furthermore, the precipitation probability is independent from the predicted precipitation quantity, meaning that a high precipitation probability
does not automatically mean "heavy rain". For example, a drizzle can occur with a very high probability through a precipitation quantity of less than 1 mm per event (e.g., an afternoon).
A thunderstorm can occur at the forecast location with very low probability, but deposits a precipitation quantity
of more than 10 mm per event in case of occurrence.
Lastly the presentation of precipitation in the forecast pictograms depends
on the precipitation probability. If a rain icon is shown in the
Pictogram,
the probability of rain is above 15%.
Interpretation
Precipitation measurements can partially be used and integrated into the forecast. However, the precision of the precipitation information is heavily dependant on the type of precipitation, the topography, and the method of observation used. A single method is not able to perfectly describe precipitation quantities within an area, as the quantity can vary substantially within a few hundred metres of distance. The method of precipitation measurements serves as an indication of development and must be checked by appropriate local reference methods.
Because the aforementioned factors, the forecast might be limited. For more information on precipitation forecast accuracy, please visit the Weather Data Accuracy pages. More general information about precipitation is shown in the meteoScool pages Precipitation and Thunderstorms.

