Aviation & Clouds
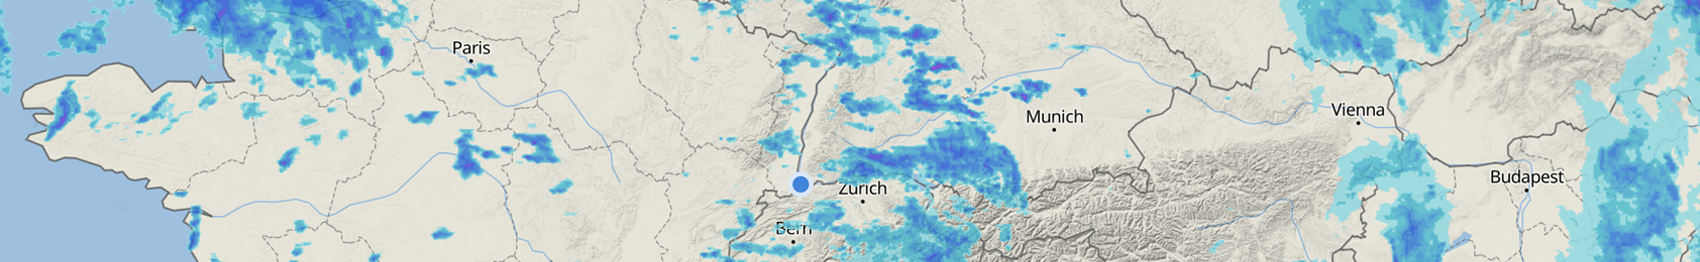
METAR
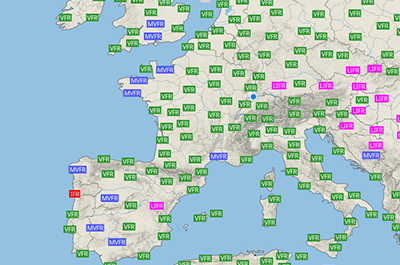
This map shows the real-time weather conditions at official airports worldwide. It is based on measurements taken at the airport. When you select a station on the map, all available information is displayed. METAR weather reports are primarily used by pilots as part of their pre-flight weather briefing.
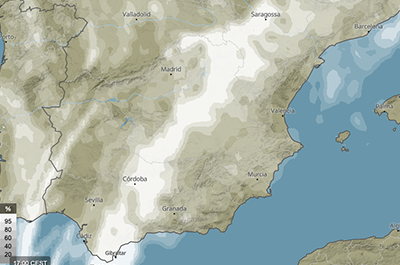
Cloud cover total
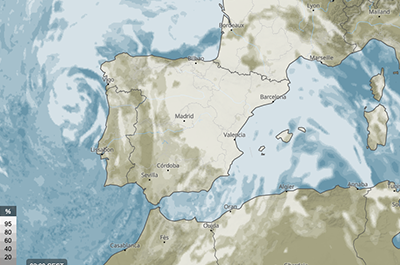
This map shows the hourly total cloud cover (%). The forecast takes into account low, middle and high clouds.
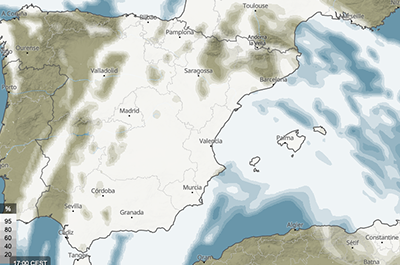
Low clouds (0-3.5 km)
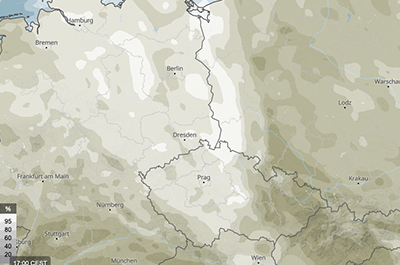
This map shows the hourly low cloud cover (%). Low clouds include the cumulus, stratocumulus, and stratus cloud types. In addition, cumulonimbus and nimbostratus can also be counted as low clouds. However, they have an immense vertical extent and their cloud top is at the level of the high clouds.
Medium clouds (3.5-8 km)
This map shows the hourly medium cloud cover (%). Medium clouds include the altocumulus, altostratus, and stratus cloud types.
High clouds (>8 km)
This map shows the hourly high cloud cover (%). High clouds include the cloud types cirrus, cirrostratus and cirrocumulus.
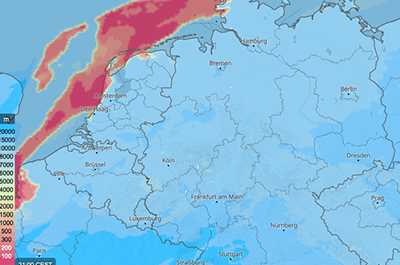
Cloud altitude
These maps show the height of the base and top of clouds. Both are expressed in meters above sea level (m asl) and visualised with colours as indicated in the legend. For more information, see clouds.
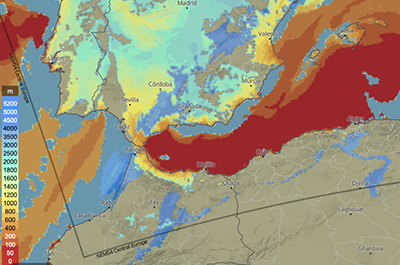
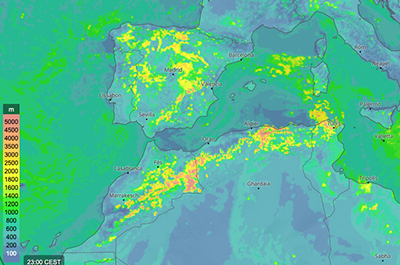
Convective cloud altitude
These maps show the height of the base and top as well as the extent of convective clouds. All values are expressed in meters (m) and visualised with colours as indicated in the legend. A large vertical extent of clouds might indicate precipitation or even thunderstorms. For more information, see clouds.
Visibility
These maps show the horizontal visibility as a distance in meters (m) with colours as specified in the colour bar. Visibility of less than one kilometer is called fog and between one and eight kilometers haze.
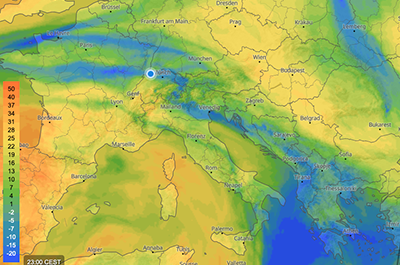
Wind convergence (10 m)
The wind convergence map shows in which regions wind converges (red areas) and where it diverges (blue areas). The data refer to a height of 10 meters above the earth's surface.
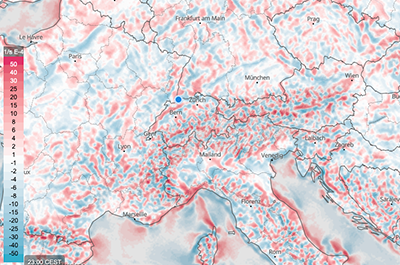
Convective updraft
These maps show the convective updraft, which is expressed in meters per second (m/s). It is visualised with colours as specified in the legend. Coupled with high humidity, high convective updraft is an indication of thunderstorm risk. For more information, see convective updraft.
Soaring flight distance
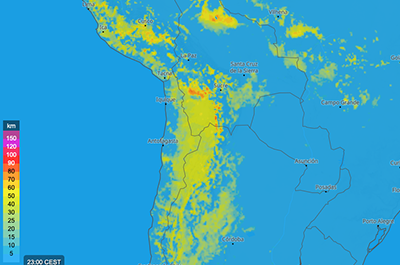
This map shows how many kilometers (km) a good pilot can fly in a glider based on the prevailing weather conditions. The different expected flight distances are shown on the map by colours as indicated in the colour scale.
Soaring index
These maps show the dimensionless soaring index with colours as indicated in the map's legend. A low soaring index indicated no or weak thermals whereas a high soaring index indicates possible thunderstorms. For more information, see soaring index.
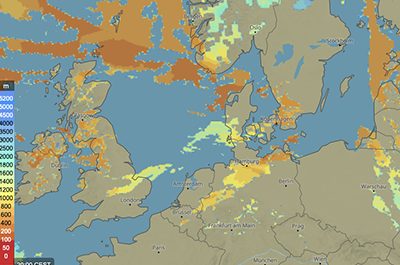
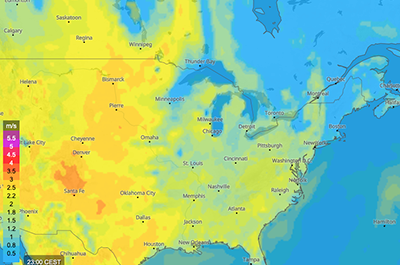
Boundary layer height
These maps show the height of the boundary layer in meters (m) with colours as defined in the colour bar. The boundary layer is the lowest part of the troposphere and is defined as the layer in which friction with the Earth's surface influences the air flow. Typically, it is a few hundreds meters to 2 km deep.
Clear air turbulence (CAT)
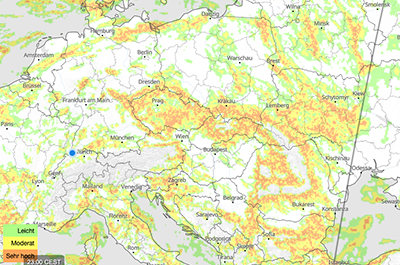
These maps show the expected intensity of clear air turbulence (CAT) with colours as indicated in the map legend. Visualising the invisible clear air turbulence on weather maps is very helpful to be prepared for regions where heavy turbulences could appear. It allows to plan a calmer flight path by avoiding regions with severe CAT. Different altitudes for the map display can be selected in the menu. For more information, see clear air turbulence.
In-flight icing
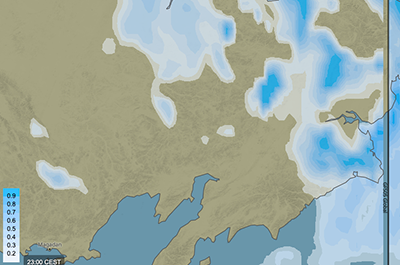
These maps show the dimensionless expected risk of in-flight icing. It is visualised with colours as specified in the colour bar and is available in different altitudes. In-flight icing occurs when supercooled water freezes on impact with any part of the external structure of an aircraft during flight. This can cause reduced performance, loss of lift, altered controllability and ultimately stall, resulting in loss of control of the aircraft. For more information, see in-flight icing.
SIGMET
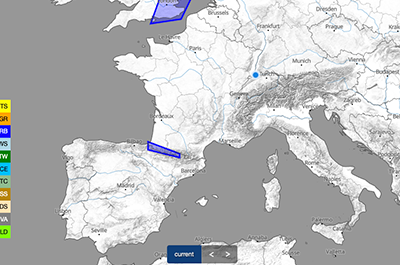
SIGMET is a weather warning system for air traffic. Warnings of danger are issued by a surveillance centre for a specific area and usually remain in effect for four hours. The warnings are visualised with colours as specified in the legend.
- TSGR = Thunderstorm with hail
- TURB = Turbulence
- LLWS = Low level wind shear
- MTW = Mountain waves
- ICE = Icing
- TC = Tropical cyclones
- SS = Sandstorm
- DS = Duststorm
- VA = Volcanic ash
- ☢ CLD = Radioactive cloud

