
Position
The position of a location or point is defined by the geographic location (coordinates) and the elevation (altitude) and can be whether on the surface or in the air.
Coordinates
Coordinates are used to define forecast locations or areas (maps), as well as to select between locations or exchange information on locations.All meteoblue coordinates follow the World Geodetic System and are given in WGS84, which uses the equator to reference latitude and the zero meridian to define the longitude. Latitude and longitude are given in degrees and decimals. Formats are:
- Latitude: from -90.0000° (South) to 90.0000°(North);
- Longitude: from -180.0000° (West) to 180.0000°(East);
ATTENTION:
- Western WGS84 decimal longitudes are NEGATIVE (-0.0001 to -179.9999)
- Southern WGS84 decimal latitudes are NEGATIVE (-0.0001 to -90.0000)
meteoblue also defines model domains by their coordinates, as well as domain grid points (center point).
Coordinates format
The following rules specify the exact format used for coordinates by meteoblue:
- All geographic coordinates MUST be valid WGS84 coordinates.
- The coordinates MUST be displayed in this order: latitude, longitude.
- The format used for representation MUST be decimal degrees.
- The decimal degrees format SHOULD use 4 decimal places after the point.
- The decimal separator MUST be a point “.”.
- Cardinal directions abbreviations (N, E, S, W) MAY be appended to each coordinate.
- When cardinal directions abbreviations (N, E, S, W) are used, then all coordinates MUST be positive. When cardinal directions abbreviations are omitted, then North and East MUST use positive numbers while South and West MUST use negative numbers.
- Each coordinate SHOULD be followed by a degree symbol (Unicode U+00B0).
- The cardinal directions abbreviations SHOULD be translated.
- When latitude and longitude are written consecutively, they SHOULD be separated by a space “ “.
Examples:
Correct: 47.5612° N 7.5734° W (With cardinal directions)
Correct: 47.5612° -7.5734° (Without cardinal
directions)
Wrong: 47.5612° N -7.5734° E (Negative coordinates mixed with cardinal direction abbreviation)
Coordinate conversion
To convert your coordinates into WGS84 units, you can use these links : EN, CH .
Altitude and elevation
Elevation is used to describe the height of ground above (or even below) mean sea level, for various purposes:
- for the model topography to calculate the forecast and the effect of local microclimate;
- to define the center of grid points;
- to describe and select locations;
- to adjust forecasts to particular locations.
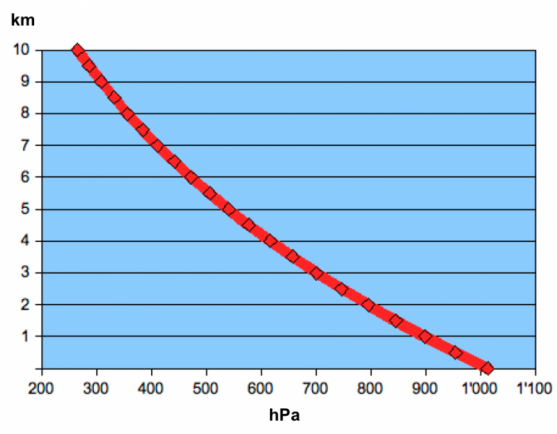
All terrestrial elevations are expressed in meters above sea level (m asl). meteoblue uses detail local topography models of 90 meters resolution and other valid data sources (by countries). Altitude (the position in the atmosphere) is expressed in meters (m), kilometre (km), or hectopascal (hPa) above sea level (asl). A graph for converting altitude into pressure or vice-versa is shown on the right above. Units are
- Altitude AMSL (in meters above sea level, = m asl).
- Altitude AMGL (in meters above ground level, m agl).
For clouds, altitude in AMSL (above sea level) is generally used. Other scales can be offered on request.
The definition of the altitude in "millibars" (or hPa) is a used in weather models whose modelling levels are not oriented in absolute values (such as "metres" , "feet") but in pressure levels (millibars or hPa) which can change (in absolute terms) depending on the weather situation and air pressure. The model output, which is in calculated in hPa, is then displayed and stored in millibars (e.g. 1000 millibars, 900 millibars, 800 millibars, 700 millibars etc.).
"Wind speed at 900 hPa" is therefore the wind speed calculated for an altitude corresponding to 900 millibars, which corresponds to approximately 1 km or around 3300 feet.
Altitude display on maps and meteograms
meteoblue offers weather information in 3-D (three spatial dimensions) and, therefore, information for different altitudes may be displayed on maps, AIR and point meteograms.In the maps, all atmospheric levels, such as the 800 hPa level, are displayed for the entire area, regardless whether there are mountains or not. The reasons are:
- In most areas with mountains, the altitude of the ground surface varies a lot within few hundred meters distance. Therefore, even in areas with mountains higher than e.g. 800 hPa level, there will be valleys which lay below 800 hPa level.
- Eliminating the grid cells with altitude higher than the 800 hPa level on the maps would eliminate some detail and make the maps more difficult to read.
- Plotting the precise mountain contours into the map would require enormous processing power, because the precision topography models required for this process would have many millions of grid cells per map, and require complex processes for filtration, rendering and display of data. We prefer to invest this processing power into better weather data.
If you want to know weather data, such as the temperature or wind in the mountains, please use the surface level maps (e.g. for temperature levels), which show the most likely conditions at the respective altitude of each model grid cell.

