
Precipitation events
The following is a summary of various studies based on daily precipitation events. These include the verification studies from 2017 and 2019 as well as the provider comparison analysis.
Statistical measures
Daily precipitation sums are used to classify precipitation events. There are four different daily precipitation event thresholds defined: Depending on the study, precipitation amount above 0.1 mm, 1 mm, 10 mm and 50 mm are estimated. For all options, it will be evaluated, if precipitation was forecasted and if it was measured, leading to different cases displayed in the following contingency table.
| Measurements | |||
|---|---|---|---|
| YES | NO | ||
| Forecast | YES | a "Hit" | b "False Alarm" |
| NO | c "Miss" | d "Correct Rejection" | |
To evaluate the accuracy of a forecast, three different categorial error metrics were applied.
POD (Probability of Detection)
POD calculates the probability if a measured precipitation event was forecasted. Values range between 0 and 1, with 1 being the best value.
FAR (False Alarm Ratio)
FAR calculates the ratio of a non-precipitation-event to all forecasted precipitation events. The values range between 0 and 1, with 0 being the best value.
The previously described error metrics give an idea of the accuracy of the forecast, showing how precise the forecast was in comparison to the measurements. The skill, however, is a measure used to evaluate the capability and competency traits of the forecast over the standard forecast. POD and FAR are error metrics which do not estimate the skill of a model. For example, the false alarm rate in deserts would also be 0 or very close to 0 as it rarely or never rains. In this case the forecast accuracy would have additionally been around or above 99%. However, a skill score quantifies the model performance to randomly correct estimates. Hence, meteoblue additionally considers the Heidke-Skill-Scrore as a skill score.
HSS (Heidke-Skill-Score)
The HSS is calculated from the proportion of correctly predicted values (PC) out of all values and the random luck value (E), which can also be calculated from the values of the contingency table (a-d). Values range from - ∞ to 1, with 1 means a good forecast.
Global verification study 2017
Throughout this study, 6505 METAR precipitation measurements (worldwide distributed) of the year 2017 were used to verify and compare our meteoblue MultiModel with other forecast models like ERA5, GFS, CHIRPS2 and NEMS.
Results
For historical data, the model performance of ERA5 and the meteoblue MultiModel is significantly better than the satellite observation CHIRPS2. Satellite observations typically perform better than numerical weather forecast models for heavy precipitation and for areas close to the equator. The following table shows also, that the metoblue MultiModel has a higher (or same) HSS than ERA5.
| Daily precipitation > 1mm | Daily precipitation > 10mm | Daily precipitation > 50mm | |||||||
|---|---|---|---|---|---|---|---|---|---|
| POD | FAR | HSS | POD | FAR | HSS | POD | FAR | HSS | |
| ERA5 | 0.69 | 0.51 | 0.45 | 0.43 | 0.64 | 0.35 | 0.11 | 0.76 | 0.14 |
| GFS | 0.69 | 0.54 | 0.42 | 0.40 | 0.69 | 0.30 | 0.09 | 0.83 | 0.12 |
| CHIRPS2 | 0.41 | 0.55 | 0.30 | 0.42 | 0.69 | 0.31 | 0.18 | 0.79 | 0.19 |
| NEMS | 0.60 | 0.50 | 0.42 | 0.39 | 0.65 | 0.30 | 0.09 | 0.80 | 0.13 |
| meteoblue MultiModel | 0.70 | 0.49 | 0.47 | 0.48 | 0.64 | 0.36 | 0.09 | 0.73 | 0.14 |
The following maps show the HSS for precipitation >1mm/day for the reanalysis model ERA5 and the meteoblue MultiModel. No significant differences can be observed within the HSS score comparing both models. Furthermore, the HSS score varies a lot throughout the globe, therefore no spatial patterns can be recognised.
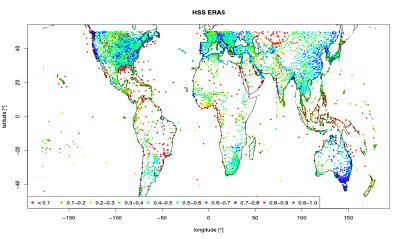
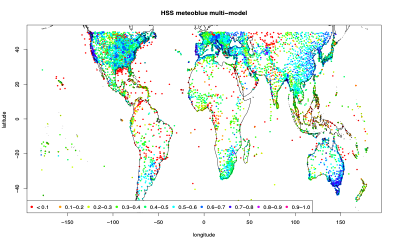
HSS for precipitation events of >1mm/day for the reanalysis model ERA5 used for long term historical analysis. Verification is based on all daily data of the year 2017, 6505 stations worldwide. HSS for precipitation events of >1mm/day for meteoblue MultiModel mix for the operational forecast. Verification is based on all daily data of the year 2017, 6505 stations worldwide.
Global verification study 2019
The year 2019 was analyzed in detail in a separate bachelor thesis (Huonder, 2020). Precipitation measurement data of 8112 WMO stations (worldwide distributed) were compared with the 24h precipitation forecast of different models (ERA5, NEMSGLOBAL, GFS05, MFGLOBAL) for the year 2019 (Bachelor thesis Huonder, 2020).
Thesis_Huonder_Verification_Of_Precipitation_Forecast_2020_DE.pdf (DE)
Results
A comparison of the HSS for different months shows that ERA5 performs very well and achieves the highest HSS for the majority of the months with the exception of November and December, where GFS has a higher HSS. The highest HSS of all models were achieved in December, the lowest HSS values occur in the northern hemispheric summer months.
| Jan | Feb | Mar | Apr | May | Jun | Jul | Aug | Sep | Oct | Nov | Dec | |
|---|---|---|---|---|---|---|---|---|---|---|---|---|
| ERA5 | 0.36 | 0.39 | 0.39 | 0.40 | 0.37 | 0.35 | 0.34 | 0.33 | 0.38 | 0.39 | 0.39 | 0.41 |
| GFS | 0.35 | 0.38 | 0.37 | 0.36 | 0.33 | 0.32 | 0.31 | 0.31 | 0.37 | 0.39 | 0.41 | 0.43 |
| MF | 0.36 | 0.39 | 0.37 | 0.37 | 0.34 | 0.30 | 0.28 | 0.29 | 0.35 | 0.38 | 0.38 | 0.41 |
| NEMS | 0.33 | 0.36 | 0.35 | 0.34 | 0.33 | 0.31 | 0.30 | 0.30 | 0.35 | 0.38 | 0.36 | 0.38 |
Intensive verifications for two separate years 2017 and 2019 have been conducted. Differences in event-based skill scores e. g., HSS, POD and FAR show no significant changes between the different years. For daily precipitation amounts larger 1 mm, considering the HSS, the reanalysis model ERA5 performs better in both years than the weather forecast models (NEMSGLOBAL and GFS). The table below shows a comparison of the different measures for daily precipitation sums over 1 mm for the models which have been examined in both studies.
| Daily precipitation > 1 mm (2017) | Daily precipitaiton > 1mm (2019) | |||||
|---|---|---|---|---|---|---|
| POD | FAR | HSS | POD | FAR | HSS | |
| ERA5 | 0.69 | 0.51 | 0.45 | 0.56 | 0.33 | 0.45 |
| GFS | 0.69 | 0.54 | 0.42 | 0.52 | 0.30 | 0.43 |
| NEMS | 0.60 | 0.50 | 0.42 | 0.56 | 0.41 | 0.41 |
Competition analysis
The competition analysis between our forecast and different competitors allows to evaluate the performance of meteoblue’s forecast in the market. The following results refer to daily precipitation events. The analysis is based on 24h precipitation forecast. The analysis was conducted for January to June 2021 for 100 locations in North America based on precipitation measurements from METAR and for 500 locations worldwide based on GSOD measurements.
Results
Looking at North America, the HSS of the meteoblue forecast for daily precipitation events larger 1 mm is slightly larger than 0.6 and within the range of the best four other meteorological weather forecast provider.
| Events > 0.1mm | Events > 1mm | Events > 10mm | |||||||
|---|---|---|---|---|---|---|---|---|---|
| Provider | HSS | POD | FAR | HSS | POD | FAR | HSS | POD | FAR |
| Provider A | 0.6355 | 0.8584 | 0.3015 | 0.6190 | 0.8538 | 0.4113 | 0.4567 | 0.5745 | 0.5781 |
| meteoblue AG | 0.6304 | 0.6988 | 0.2000 | 0.6116 | 0.8596 | 0.4213 | 0.4732 | 0.6596 | 0.5921 |
| Provider B | 0.5007 | 0.6050 | 0.4706 | 0.3663 | 0.6154 | 0.7037 | 0.1961 | 0.1667 | 0.7500 |
| Provider C | 0.6403 | 0.8125 | 0.2798 | 0.6431 | 0.8704 | 0.3974 | 0.4841 | 0.6190 | 0.5667 |
| Provider D | 0.6377 | 0.8163 | 0.2773 | 0.6050 | 0.8012 | 0.4043 | 0.4809 | 0.5957 | 0.5556 |
| Provider E | 0.6071 | 0.7328 | 0.3144 | 0.6163 | 0.8257 | 0.4410 | 0.3997 | 0.3438 | 0.4762 |
| Provider F | 0.5125 | 0.8404 | 0.3961 | 0.4421 | 0.8596 | 0.5727 | 0.2832 | 0.7021 | 0.7800 |
Note, that the HSS for North America is typically larger than for the entire world, where the meteoblue forecast reaches HSS values of 0.44 (based on the analysis between January and June).
Recent updates on this study, where the second half of the year was included as well, shows an even higher worldwide HSS of 0.49 for the meteoblue forecast (for precipitation events higher than 1 mm), as displayed in the table below:
| Raw Model | Events > 0.1mm | Events > 1mm | Events > 10mm | |||||||
|---|---|---|---|---|---|---|---|---|---|---|
| HSS | POD | FAR | HSS | POD | FAR | HSS | POD | FAR | ||
| 1 | meteoblue | 0.51 | 0.78 | 0.40 | 0.49 | 0.79 | 0.47 | 0.37 | 0.47 | 0.62 |
| Provider_C | 0.40 | 0.77 | 0.48 | 0.44 | 0.69 | 0.48 | 0.33 | 0.40 | 0.63 | |
| 3 | Provider_D | 0.42 | 0.89 | 0.50 | 0.47 | 0.80 | 0.49 | 0.36 | 0.46 | 0.62 |
| 2 | Provider_F | 0.44 | 0.83 | 0.47 | 0.47 | 0.76 | 0.48 | 0.35 | 0.42 | 0.62 |
| Provider_H | 0.36 | 0.81 | 0.52 | 0.37 | 0.78 | 0.57 | 0.23 | 0.62 | 0.79 | |
For all precipitation events, the meteoblue forecast has a higher HSS than the other chosen providers.

