
Weather data accuracy
- What is verification?
- Why publish verification data?
- A summary of key results
- What is being verified? Data accuracy by data source
- Accuracy by variable
- Accuracy by time range (forecasts, historical data)
- Accuracy by region
- Accuracy by season
- Accuracy by technologies
- Accuracy compared with other providers
- Accuracy over time
- Literature
What is verification?
Verification is the process of assessing the accuracy of information. At meteoblue, we regularly conduct extensive verification of our own weather data, as well as that of other weather data sources (mainly simulation models), by comparing them to measurements and observations.
Accordingly, we can ensure that our services deliver highly accurate (and continuously improving) historical and forecast weather data.
Why publish verification data?
In 2010, meteoblue became the first commercial weather service worldwide to regularly publish verification data and daily local accuracy updates on the company website.
Our reasoning behind publishing these data is based in our commitment to transparency, which is a part of our company philosophy. We want our customers to know what to expect from our services, and thus allow them to make an informed decision before contacting us. The publications also serve as a showcase of the high quality of our data and as reference benchmarks for our continued improvement.
This page and its subpages will show you some of the most important studies regarding the accuracy and deviation between weather simulations and measurements.
A summary of key results
The most important results achieved by meteoblue reflect the current state of the art:
- Temperature forecasts achieve an hourly MAE (mean absolute error) of 1.2°C for a 24-hour ahead forecast - since 2018.
This can - on average - be considered as precise as two measurements taken within 100 meters distance. - Temperature forecasts achieve an hourly MAE of 0.8°C for a 12-hour ahead forecast.
This can - on average - be considered as precise as two measurements taken on opposite sides of a house. - Wind speed forecasts achieve an hourly MAE of 1.8 m/s for a 24-hour ahead forecast.
This can - on average - be considered as precise as two measurements taken at 100 meters distance. - Precipitation forecasts achieve an HSS of 0.49 for daily precipitation > 1 mm for a 24-hour ahead forecast.
This can - on average - be considered more precise than the reanalysis model ERA5, which re-calculates simulations using measurements in a 30x30km grid.
Since 2018, these remain the highest publicly documented accuracy levels in the industry.
What is being verified? Data accuracy by data source
We verify mainly simulations (numerical models),
because these offer the widest spatial and temporal coverage.
Observations
and measurements can (and must) also be verified.
Accuracy by variable
The accuracy of a weather simulation model significantly depends on the chosen meteorological variable. Meteorological variables like the 2m air temperature, surface pressure or the 500hPa geopotential height are typically calculated with high accuracy, whereas other variables such as precipitation and wind gusts have a lower accuracy, typically caused by small-scale spatial variations, which are not resolved in weather models.
The following are the key variables we verify:
- Air temperature (°C) at 2 meters above ground
- Wind speed (m/s) at 10 meters above ground
- Solar radiation (W/m²) at ground level
- Precipitation amount (mm) at 2 meters above ground
- Dew point temperature (°C) at 2 meters above ground
Variables such as wind direction, sunshine time, cloud cover, evapotranspiration, among others, are much more difficult to be verified, due to the lack of comprehensive measurement data and the interaction of some of these variables with local conditions (e.g. cloud cover depends on the topography and exposure, evapotranspiration depends on the growth state of plants).
Such variables can be verified in the form of specific, focussed projects.
Air temperature
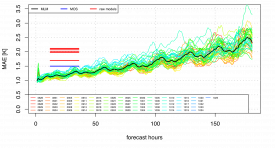
The 2 m air temperature is best calculated by the meteoblue Learning MultiModel (mLM) with values of MAE = 1.2 K. The MOS air temperature forecast gives the same accuracy as the reanalysis model ERA5 (MAE = 1.5 K), which is recommended for historical data sets. The ‘stand-alone' (RAW) global weather forecast models perform in the range between 1.7 and 2.2 K. Hence, the 6-day forecast of the meteoblue MultiModel is as good as the 1-day forecast of a ‘stand-alone' (RAW) numerical weather forecast model.
Wind speed
The model uncertainty of the forecasted 10 m wind speed is within 1.5 - 1.7 m s-1 by using ‘stand-alone' weather forecast models and for historical data 1.5 m s-1 by using the reanalysis model ERA5. The model error could be reduced to 1.2 m s-1 for model simulations with MOS.

Radiation
meteoblue calculates radiation for the land and sea surface and for atmospheric layers, both as incoming direct and indirect sunlight, as well as reflected radiation from clouds or surface. The meteoblue simulations for global surface radiation is consistent over continents and reaches a monthly mean absolute error of 1-15% in 95% of all places.

Precipitation
The model skill of daily precipitation events decreases with increasing precipitation intensity. Numerical weather forecast models are the best source for detection of small precipitation events. For heavy precipitation events, the model skill of satellite observations is larger than those of numerical weather forecast models. The model skill could not be increased by mixing two (or more) models for daily precipitation events.
For historical data, annual precipitation sums are calculated best by using satellite observations from CHIRPS2, which are bias corrected with the same measurement data set used for verification in this study. The model accuracy of CHIRPS2 in regions without measurement stations is therefore expected to be significantly lower and to a certain extent unknown.
Dew point temperature
The model accuracy for the dew point temperature is slightly lower than the model accuracy for the air temperature. MAE values are between 1.9 - 2.4 K for numerical weather forecast models and 1.6 K for a reanalysis model. The accuracy of model simulations with MOS are in a similar range to those of the reanalysis model.
Accuracy by time range (forecasts, historical data)
For more information, see our data sources page.
Accuracy by region
The accuracy of simulations depends on the following factors:
- Topography of the area
Mountains produce a far more varied distribution of states than plains. - Land cover
The type of surface (water, swamps, fields, forests, rocks, sand, etc.) influences the variability of the weather, and consequently the simulation accuracy. - Weather events
Weather events vary from macro-scale (trade winds, fronts, hurricanes) to microscale (convection, fog, thunderstorms, tornadoes). The frequency of such events depends on the regional climate. - Measurement accuracy
Although measurements are independent of geography, the regional distribution varies, with generally more measurements being available from regions with high population density. You can see real-time measurements on our maps.
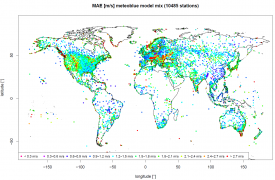
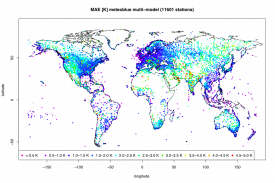
All these factors vary by region. meteoblue has conducted the most comprehensive publicly available studies on global accuracy distribution.
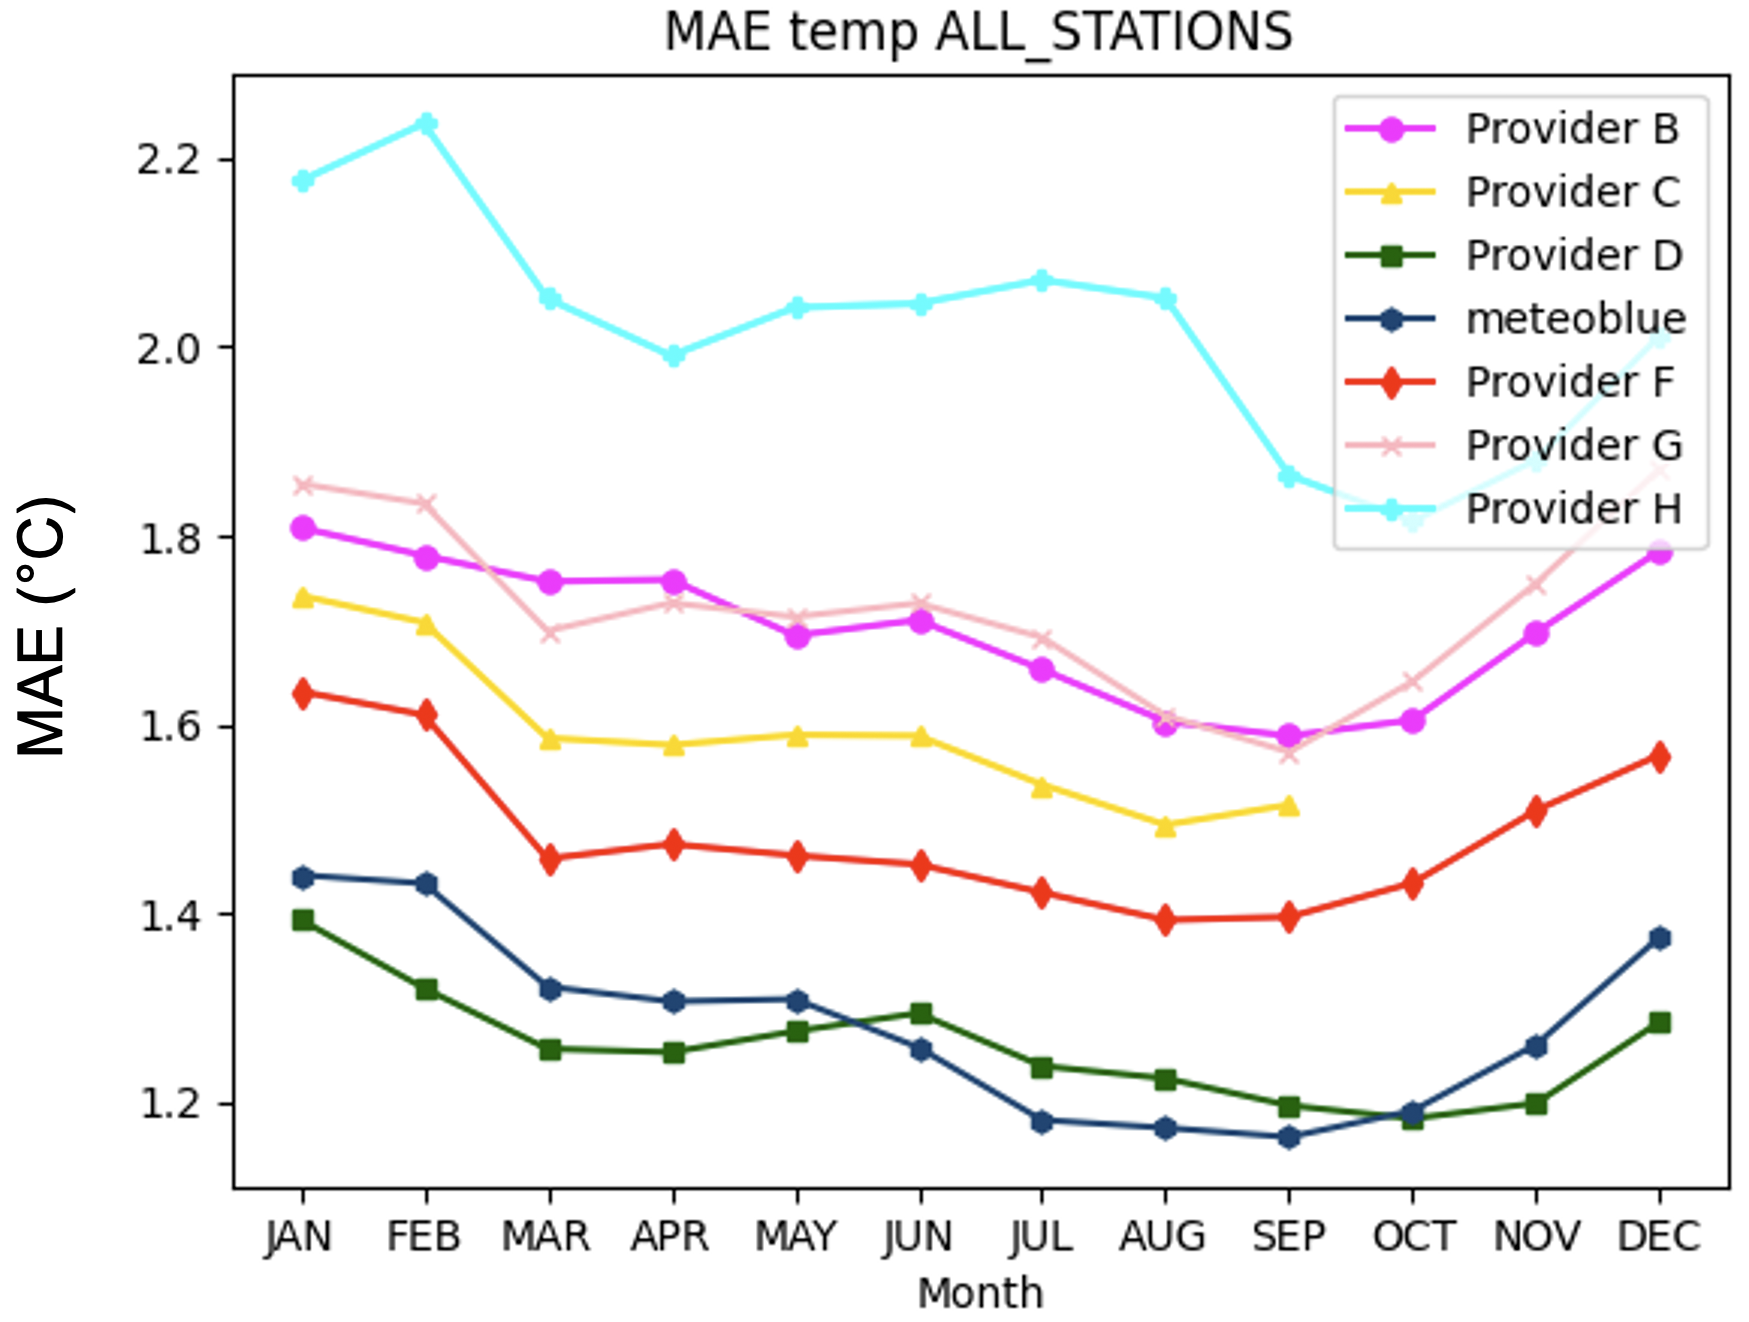
Accuracy by season
The seasons have an influence on the accuracy of the simulations (and even of measurements), mainly because certain seasons produce more micro-scale events (such as thunderstorms, tornadoes) which are more difficult to simulate and measure.
More information can be found in some of the studies conducted within our cooperation programme.
Accuracy by technologies
The accuracy of simulations depends on the technology used. The main approaches are the following:
- Models, which produce raw output in different model resolutions
- MOS (Model Output Statistics), a method using local measurements to correct model output by statistical post-processing. Its results depend on the proximity to measurement locations
- MultiModel (MM) approach. The advanced version uses a learning approach, which selects the most suitable out of many models using weather measurements. It can be applied to larger ares, since models cover entire regions.
A comparison of the accuracy of the different methods can be found on the verification page for temperature.
Further information can be found here.
Accuracy compared with other providers
meteoblue achieves outstanding results when compared to other weather data providers:
In a global comparison study for the hourly temperature forecast 24 hours ahead, encompassing 475 stations, meteoblue came in second with 1.29°C MAE compared with 1.26°C from the best provider.
For the 12 hours ahead forecast, meteoblue came in first with 0.9°C MAE compared with the 1.16°C of the next best provider.
For the hourly wind speed forecast 24 hours ahead, meteoblue came in first with 1.36 m/s MAE compared with 1.38 m/s from the next best provider.
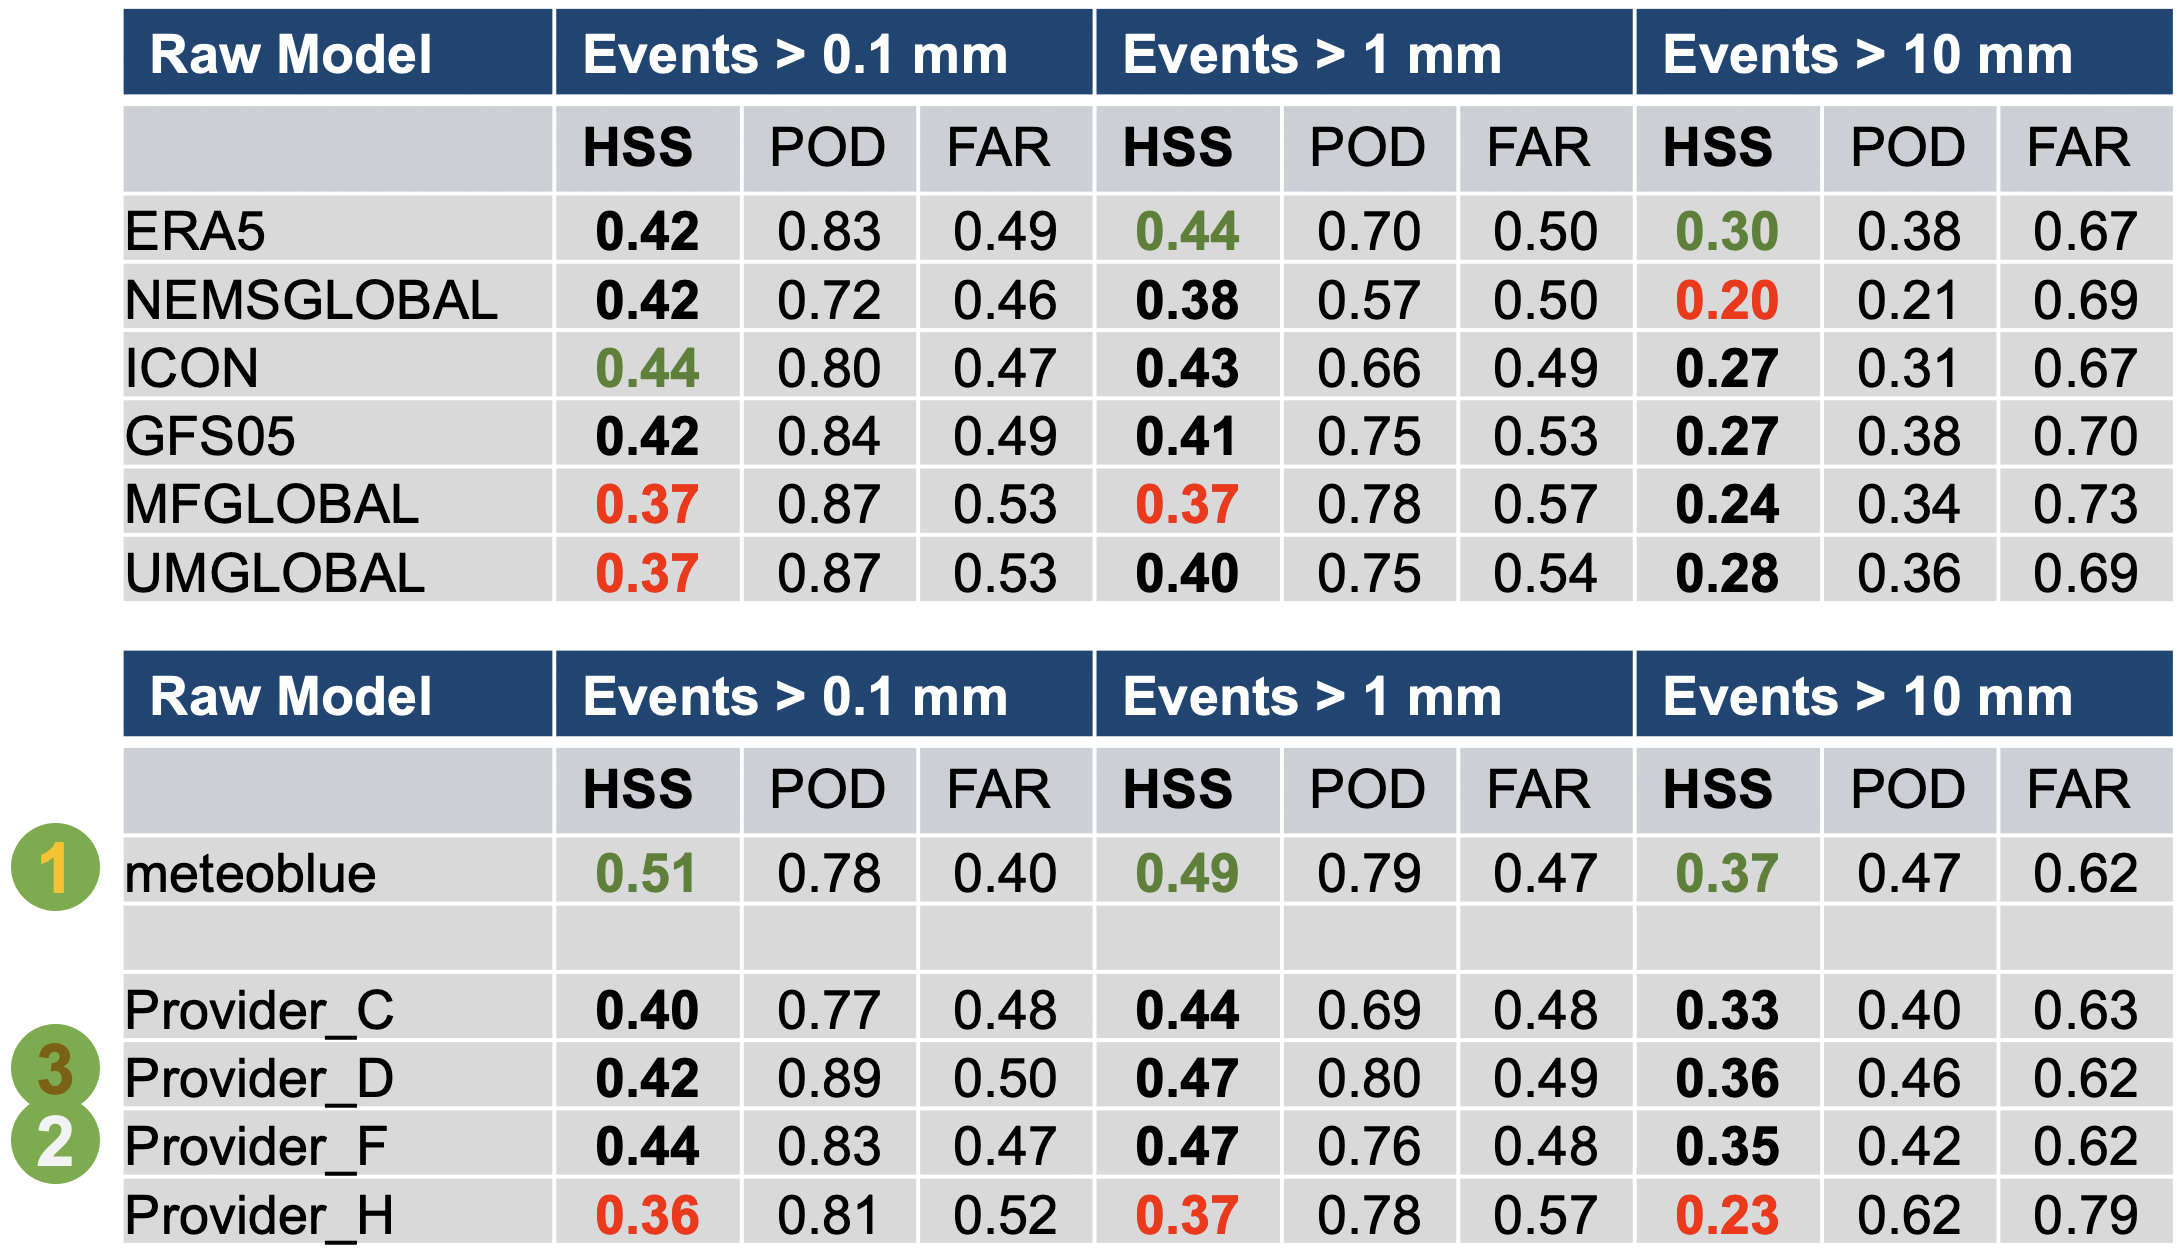
In a global comparison study for the >0.1mm and >1mm daily precipitation forecast 24 hours ahead, meteoblue scored an HSS (Heidke Skill Score) of 0.51 and 0.49 respectively, far better than any other provider, which came in with 0.44 and 0.47. meteoblue precipitation forecast scored better than the ERA 5 reanalysis which achieved 0.42 and 0.44.
Accuracy over time
Numerical weather forecast models have been continuously improved in the last decades. Around 1980, the 24-hour ahead forecast of the air temperature was calculated with an accuracy of around 70%, which had increased to around 90% by 2018: the 72h forecast nowadays is as good as the 24h forecast was 40 years ago. The accuracy of the 500 hPa geopotential height (around 5 km altitude) from numerical weather forecast models is even higher than the accuracy of the 2 m air temperature simulation. The evolution of the model accuracies over time can be seen in the following figure (Source: ECMWF).
Three main factors are responsible for the increase in model accuracy over the past 40 years:
![Evolution of the forecast skill [%] of the 500hPa geopotential height from 1980-2013.<br />(Source: ECMWF, 2013)](/assets/images/graphics/forecast-skill-500hpa-geopotential-height_two_columns_of_four_lightbox.jpg)
- More precise initial conditions
The numerical weather forecast models start calculations with a much better estimate of the atmospheric conditions. New meteorological measurement techniques (e.g. satellite observations), more widespread and accurate measurements are responsible for this improvement. - Higher resolution
The increase in computational power allows for finer horizontal and vertical resolution of the numerical weather forecast models. - Better sub-grid parametrizations
The sub-grid parametrization improved over the last 40 years, as scientists developed better algorithms to estimate sub-grid processes such as thunderstorms and atmospheric turbulence, mostly with the help of high quality measurement experiments.
We expect the trend of increasing accuracy to continue for the next two decades, and aim to remain a leader in that progress.
Literature
A comprehensive verification study of air temperature, wind speed, precipitation and dew point temperature conducted over more than 10'000 meteorological stations worldwide for the year 2017 can be downloaded below:
meteoblue_verification_global_Summary_2017_EN_20181113z10.pdf (4.23 MB)
A global verification of temperature, dew point temperature, and wind speed for the new Nonhydrostatic Multiscale Model on the B Grid (NMMB) is computed for a 3-yr period (2010-12) using over 9000 weather stations. The raw model forecasts, as well as bias-removed MOS forecasts, are analyzed and compared to NOAA's operational GFS.
mueller_janjic_2015_verification_AMS.pdf (30.9 MB)
A verification study was done for Europe in 2011, comparing the model accuracy of weather models with 40, 12 and 3 km spatial resolution, for the air temperature and wind speed by using MOS and raw models. The study can be downloaded here:

