
Stueve & Sounding
Stueve
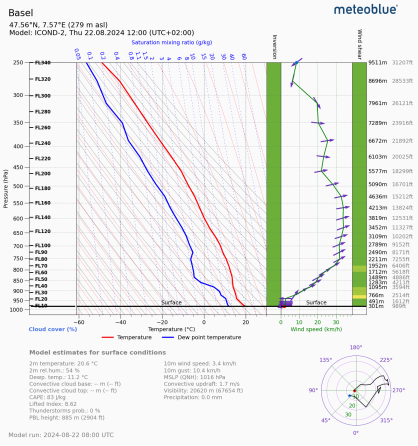
The Stueve Diagram allows you to know a lot about the air conditions within only one diagram.
The temperature is shown on the abscissa axis, with vertical lines (isotherms). The air pressure is shown on the ordinate axis with horizontal lines (isobars) and an exponential scale.
The black oblique lines show the dry adiabatic lapse rate with always the same slope, while the red oblique lines show the saturated adiabatic lapse rate with the slope changing with the temperature and pressure.
The saturation mixing ratio is indicated with dotted blue lines and the values are written on the top of the diagram in g/kg. This corresponds to the ratio of the water vapour mass in an air volume compared to the dry air mass. It is helpful to find the absolute humidity.
The red curve corresponds to the forecasted temperature, while the blue curve corresponds to the forecasted dew point.
The mixing ratio value corresponding to the temperature gives the maximum water amount that a kilogram of air can contain. The mixing ratio value corresponding to the dew point temperature gives the effective water amount contained in a kilogram of air. The relative humidity is then the percentage found comparing the dew point value (g/kg) with the temperature value (g/kg). Thus, the closer the temperature and dew point lines, the higher the relative humidity.
The surface is indicated with a black horizontal line. The cloud cover is shown in percent (%) on the left with grey areas showing the altitude and density.
If a temperature inversion is present, a yellow/orange area in the
green column with altitudes (m) will be shown.
In the column on the right,
the wind speed and direction are shown.
The wind speed is shown with a green curve in km/h, while the wind direction is shown with arrows.
In the right lower corner of the diagram a hodograph is shown. A hodograph is a diagram that represents the movement of a body or a fluid in an vectorial visual shape. It is the locus of one end of a variable vector, with the other end fixed. It is also called a velocity diagram, because the position of any plotted data on such a diagram is proportional to the velocity of the moving particle.
Sounding
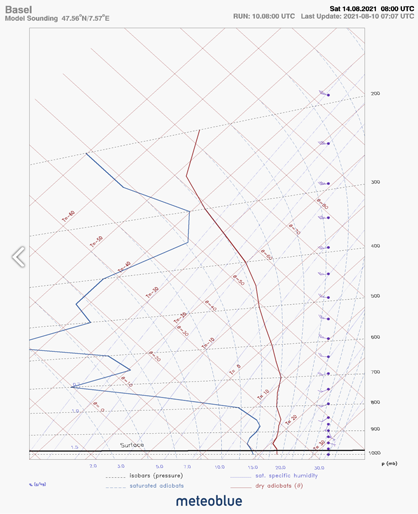
The meteoblue Sounding shows the weather development in the atmosphere, from ground to stratosphere level (pressure levels 1013 to 100 hPa) simulating the measurements of a sounding balloon.
The temperature is shown by the red curve. You can see the value looking at the oblique red lines (T=...). The blue curve corresponds to the temperature of the dew point. When both curves are very near to each other, the precipitation probability is then high, and the relative humidity is also higher, as the values of the mixing ratio of both temperatures are near to each other.
Other weather variables shown are the dry adiabatic gradient (red oblique line theta), the saturated adiabatic gradient (blue dashed line) and the saturated specific humidity (blue dotted line) at pressure levels (black dashed line) 1013 to 200 hPa for a selected hour. At higher altitudes, the pressure which is expected or measured at the local ground level should be used to determine the weather variable values which can be expected on ground level. Since a Sounding is valid for a larger area, the altitude of the selected location is not shown in the diagram. Adjustments to the selected location may thus be necessary in mountainous terrain.
On a Sounding, you can also see the wind speed and direction (wind barbs) at each altitude.
meteoblue Soundings are available worldwide. They are presented in local time, depending on the chosen location, as well as in UTC time (Coordinated Universal Time). For the meteoblue domains, they are offered at intervals of 1 hour from current time to 6 days ahead. In other areas, they are presented at 3 hour intervals, e.g. for 09:00 UTC, 12:00 UTC, 15:00 UTC, etc. For conversion of UTC into local time, see our time page.
Resolution
The Stueve Diagram and Sounding are valid for a selected grid cell. The resolution depends on the region. For Central Europe the ICON2 model is used for the 3 day forecast and the NEMS12 model for the 6 day forecast.
Availability
meteoblue air soundings are available worldwide via point+. Further, they can be supplied via our meteoblue API.

