
Climate Observed Diagram
The Climate Observed Diagram shows the annual course of temperature, precipitation amount and days, as well as wind measurements from a closest weather station. The weather variables shown depend on the availability of complete and consistent measurements from the measurement station and are aggregated on a weekly or monthly basis.
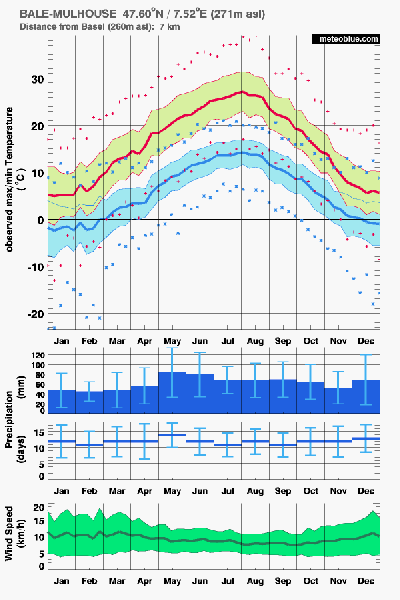
- The first diagram shows the average, the maximum (red) and the minimum (blue) temperatures. Extreme values are represented by + and * characters. Two thirds of observed temperatures lie within the coloured temperature range.
- The second diagram shows the precipitation amount (in mm) and the range of monthly means in two thirds of the years.
- The third diagram shows the number of days per month with precipitation and the two thirds variation within the bars.
- The last diagram shows the observed daily mean wind speed and the two thirds range of weekly means.
The measurements include at least 10 years. Weather stations with shorter measurement time series are not
considered. Therefore, the weather station displayed may not always be the nearest station with
measurements.
The Climate Diagram thus gives an overview of the possible weather conditions in the
area of the selected location. In order to assess the situation at the selected location, consider the distance and
the altitude difference (m asl) to the observation station.
You can also compare the data to the archive simulations for the station and for the selected location - this will give you an idea of the expected differences of the weather between the station and the selected location.

