
Air
meteoblue Meteogram Air shows the weather development in the atmosphere, from ground to around 5500 meters elevation (pressure levels 1020 to 500 hPa) simulating the air layerings above the selected location. The weather variables are shown for 3 to 6 days ahead.
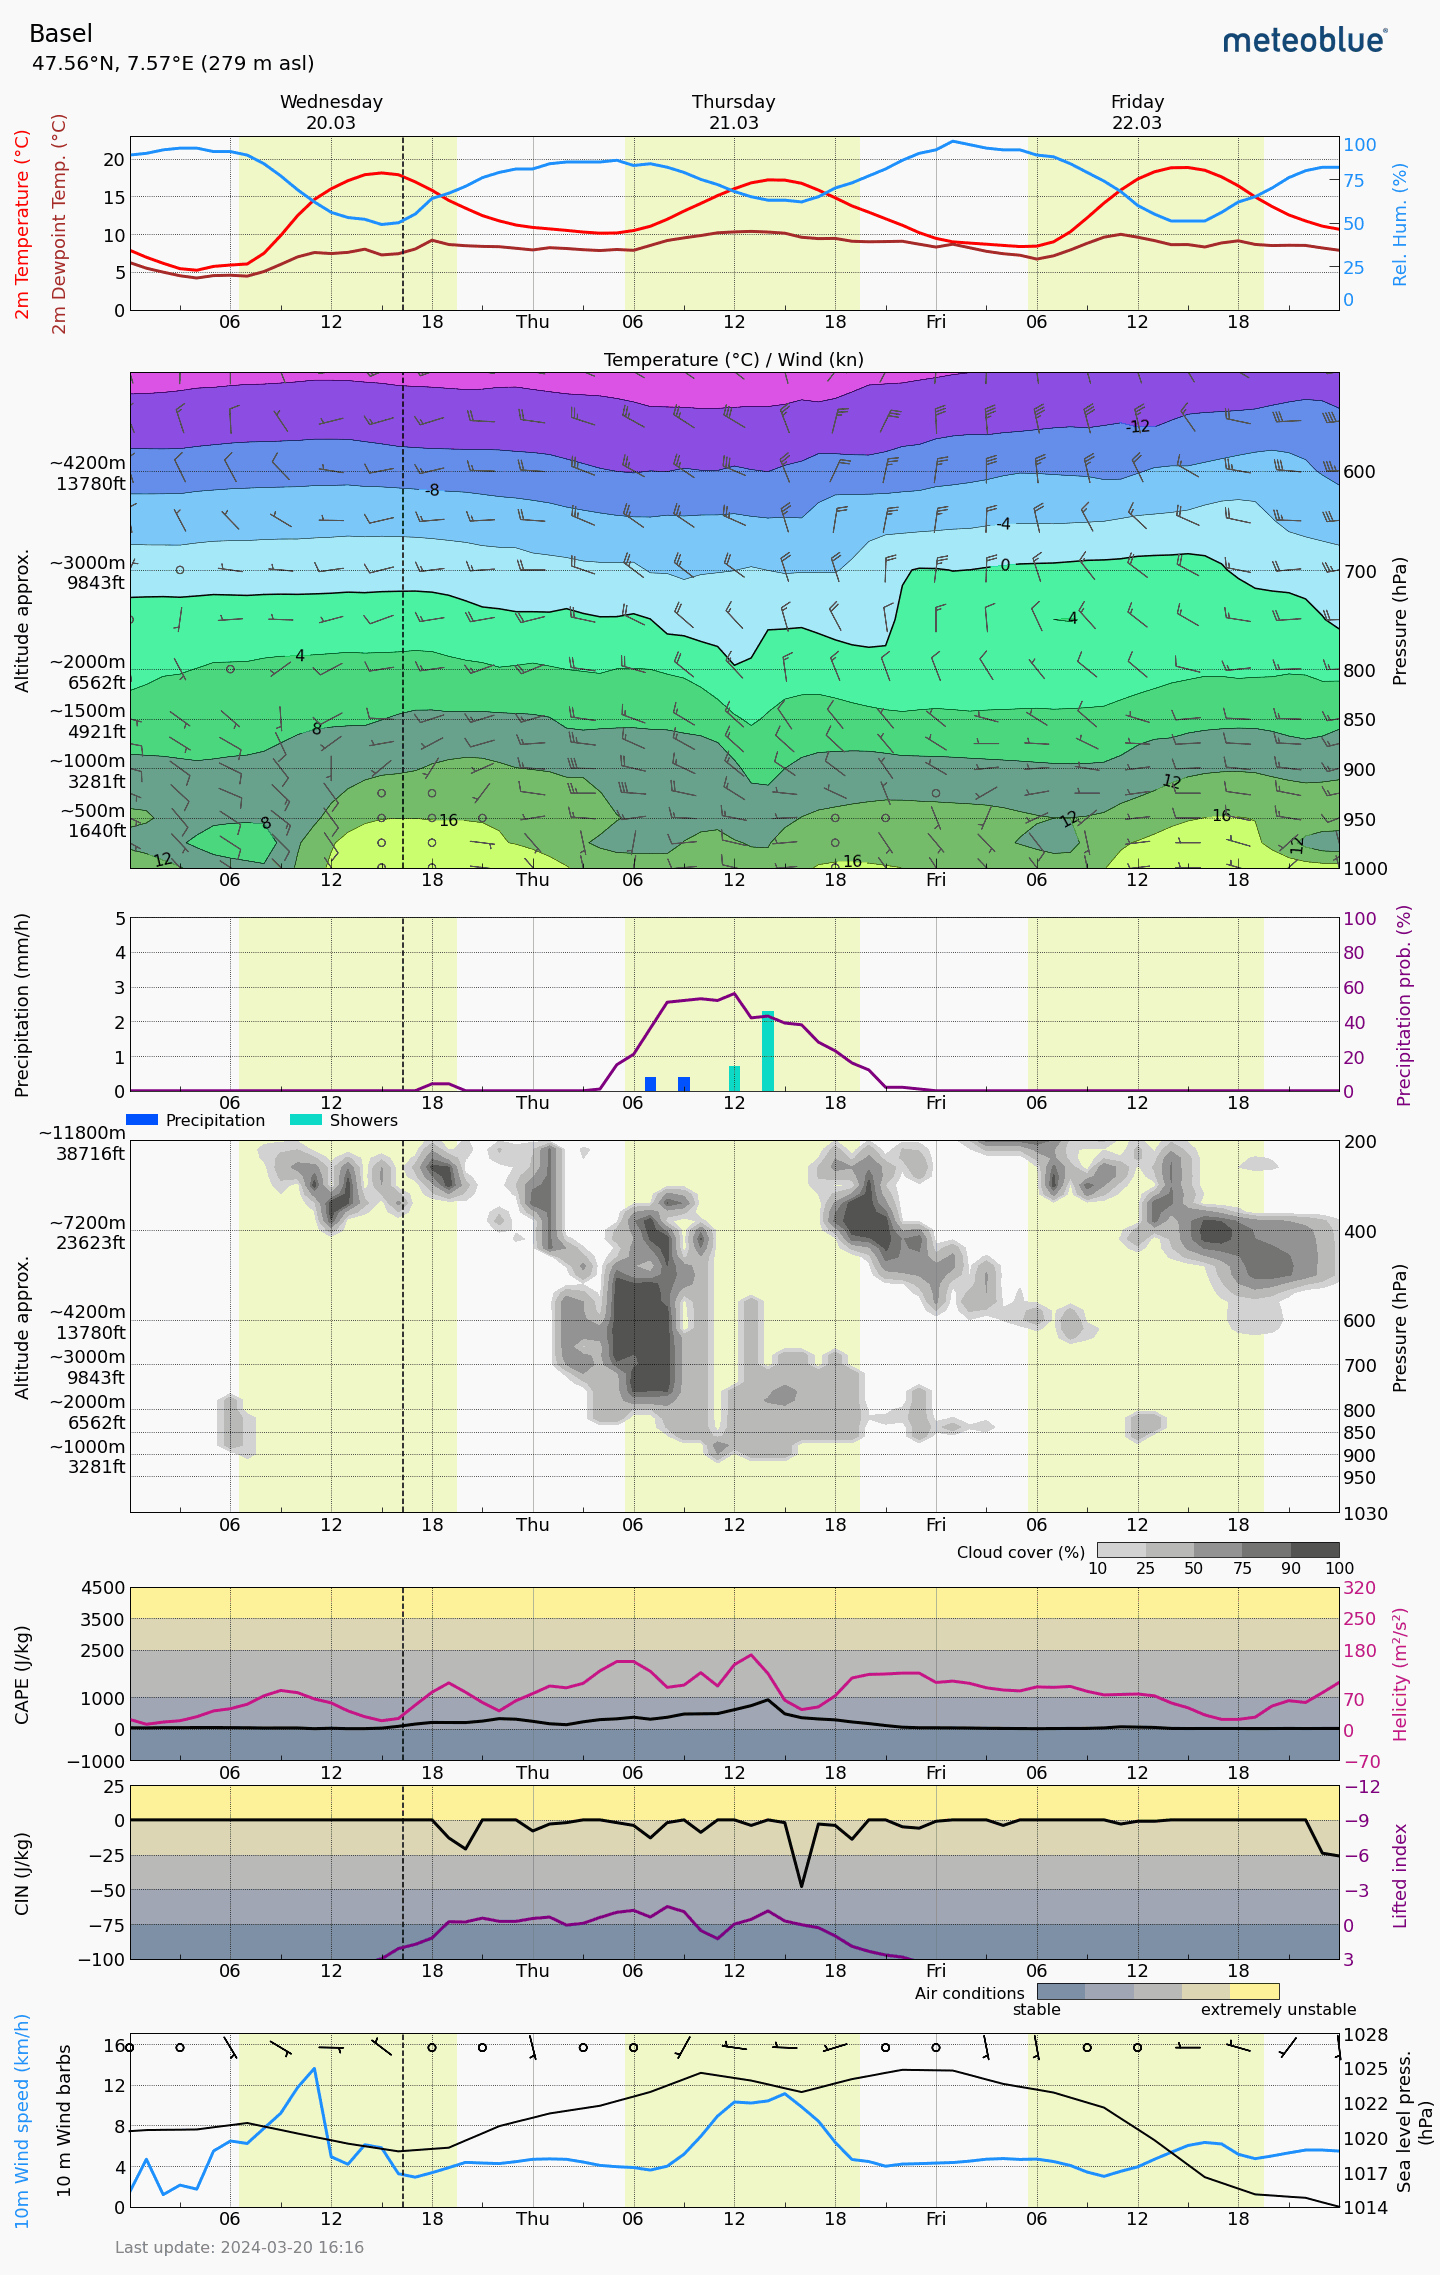
The first diagram shows the temperature at 2 m (orange curve), the relative humidity in % (blue curve) and the dew point temperature at 2 m (brown curve).
You then find the air temperature (colours in the background) and wind speed and direction (wind barbs) at ground and various atmosphere levels (in hPa), including the zero degree (°C) line (black). An explanation of the wind barbs is shown on the wind page.
The next diagram shows the expected precipitation amount in mm of rain and probability in % (pink curve), with symbols to indicate the precipitation type.
Below you find the clouds diagram, which gives an indication about the cloud coverage (in %) for each atmospheric altitude (hPa).
There is then the wind diagram, showing the wind speed in km/h (blue curve) and direction with wind barbs. Here you also find the sea level pressure ("SLP", thin black curve) in hPa. We also recommend using our clouds weather maps to analyse local differences and clouds developments over time.
The following diagrams show different air stability indices such as CAPE, Helicity and Lifted Index. The background color also categorises the air conditions from stable to extreme unstable.
Meteograms Air are useful for flight planning, paragliding and mountaineering, as well as for making weather forecasts for specific areas. With the help of the weather variables for the individual air layers, the weather conditions in different altitudes can be interpreted.
Check out the Meteogram Air on our website.
Grid cell
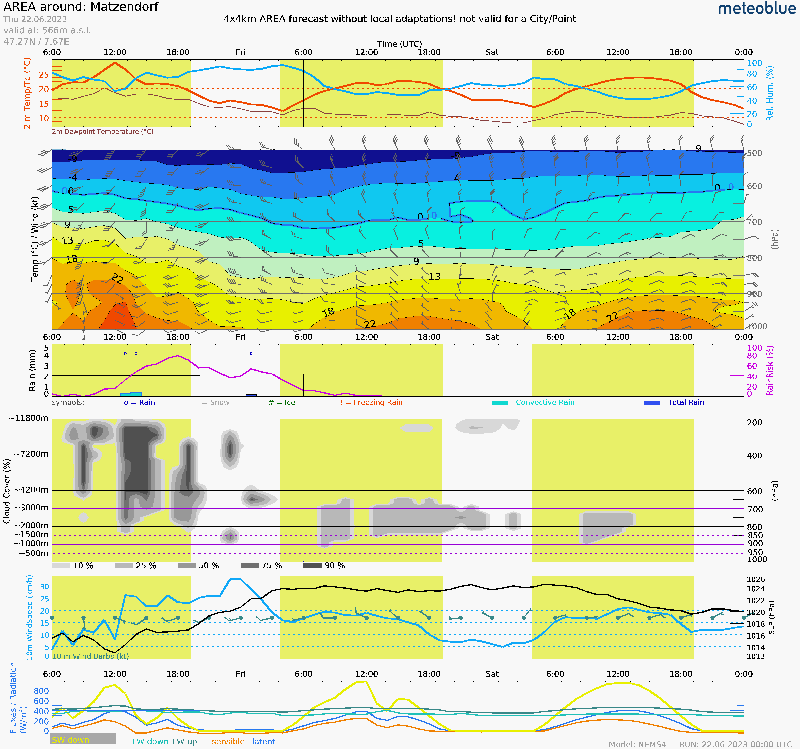
meteoblue Meteograms Air show the weather for the surrounding area, corresponding to a model grid cell. The specific conditions of the selected location (altitude, inclination) are not displayed in the Meteogram Air. The ground level of the selected location may be lower or higher than the altitude shown by a Meteogram Air. The average altitude of the surrounding area is shown by a line in the temperature chart and a brown bar at the bottom of the cloud chart. A conversion of pressure levels to altitude is shown on the position page.
The differences in altitude between the Meteogram Air and a local (point®) forecast: In point forecast, we consider the real altitude of the location, in the Meteogram Air we consider the altitude of the grid cell. This may lead to significant difference in altitude in some places. A difference in altitude means a difference in temperature. We correct the temperature on the basis of the layering of air in our forecast model. So there is not a fix correction, but a dynamic correction. Thus, we ensure that the local forecast in lower altitudes is warmer under normal conditions and colder with inversion situations.
The real altitude of the selected location is not displayed in the Meteogram Air for several reasons. One key reason is the sheer number of altitude levels in mountainous grid cells. There can be hundreds of these, making it impossible to represent all of them.
Another reason pertains to the maximum and minimum altitudes in each grid cell. These values can vary based on the terrain model used. Typically, such models have a resolution of about 80x80 meters. This may lead to contradictions as known peaks in the grid cell could be higher than the maximum of the 80x80 meter model, causing confusion. A similar situation arises with the minimum altitudes.
The resolution of the grid cell also changes depending on the forecast range. For predictions spanning 1-3 days, we utilise models with a 2-4 km resolution. Beyond this range, we employ a 12 km resolution model (as shown in the MultiModel). As a result, the contour lines, or the maximum and minimum altitudes, would change on the fourth day, adding to the potential confusion.
In terms of the representation within grid cells, lower clouds might not be visible in a grid cell with a high "base". However, the height of the cloud base wouldn't be relevant for aviators, since they wouldn't be able to fly (and, aside from commercial aviation with IFR, wouldn't be allowed to) in a weather situation where the cloud base is lower than the average terrain height.
For more precise considerations concerning cloud base and adiabats, we offer Stueve Diagrams and the Meteogram Thermal Forecast. These tools present all the necessary information on cloud base and humidity.
Please note that, even if there might be models available with a higher resolution (e.g. NAM12 for North America), the Meteogram Air might show model data with a lower resolution anyway (e.g. NEMS30 in this case). The reason is that the former model, while having a higher resolution, doesn't provide data for all variables and layers that are required for the Meteogram Air.
For a local precision forecast, please consult the Meteogram 5-Day.
Availability
meteoblue Air for 3 days is available for free, the Meteogram Air for 6 days is available via point+. They can be supplied also via our meteoblue API.
Ground level
Detailed local ground forecasts for specific locations are available in the pictocast and meteograms.

