
Weather simulation data
meteoblue offers weather simulation data from its own proprietary models, from third party weather models and from (third party) reanalysis datasets. Therefore this section has three subcategories:
- meteoblue models with their specifications (history & forecast)
- Third party models with their specifications (history & forecast)
- Reanalysis datasets with their specifications (history only)
For a better understanding of the characteristics of weather simulation data we have created a subsection which explains the difference between simulated and measured weather data.
Characteristics of weather simulation data
This page gives an overview of:
- Weather simulation data - what's that?
- Why is meteoblue simulation data comparable to measurement data?
- Profiles of grid cells with simulation data and measurement data
- Calculation of simulation data
- Availability of meteoblue simulation data vs. measurement data
- Applications for simulation data vs. measurement data
Weather simulation data - what's that?
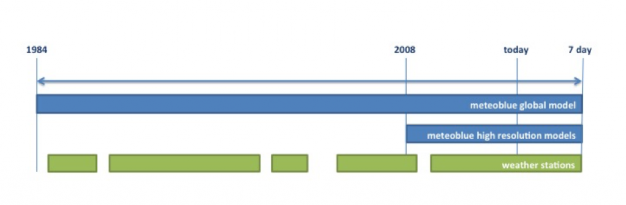
meteoblue forecasts are calculated with its own models and not from individual weather stations. These weather models are based on the NMM (Nonhydrostatic Mesoscale Modelling) and NEMS (NOAA Environment Monitoring System) technologies which enables the inclusion of detailed topography, ground cover and surface cover. Each forecast is archived by meteoblue at least once a day. From this data, we create a complete hourly history of the weather situation, which we can deliver for every place in the world from 1984 until today.
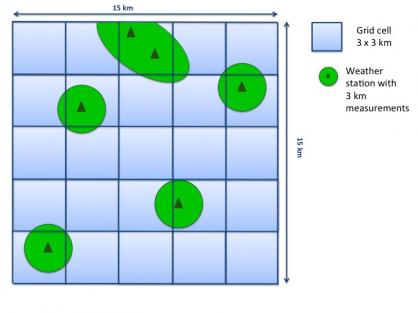
Reliable weather measurement stations are scarce, and most their data are representative only for a radius of 3 to 12 km surrounding the station. This means that less than 1% of the Earth's surface is covered by measured data. For the atmosphere, even fewer measurement data exist. Since weather stations are located unevenly on land surfaces, you will typically find weather stations near you. In most areas, stations are widely spaced and especially in South America / Africa / Asia / unpopulated areas you will not find any weather station near you.
meteoblue weather simulations, however, cover the whole Earth surface, including the sea and mountainous areas. Therefore, meteoblue can offer forecast and historical data for any place in the world, including the atmosphere above us.
The weather data is always calculated for the grid cell centre and the average altitude of the grid cell. Temperature (and temperature-related) data are additionally downscaled to the respective altitude of the location. A high-resolution (80 meters) topography model defines the location's altitude.
Why is meteoblue simulation data comparable to measurement data?
There are a lot of reasons why the meteoblue simulation data is comparable to measurement data. The most important criteria are shown in the table below:
| meteoblue simulation data | weather station measurement data | |
|---|---|---|
| Spatial resolution |
3 - 30 km 
|
< 1 km 
|
| Worldwide coverage |
100% 
|
< 1%
|
| Number of weather variables |
45+ 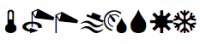
|
< 10 
|
| Number of years |
> 30 
|
2 - 30 (with gaps) 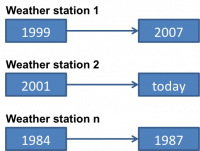 |
| Time intervals |
hourly, 3 hourly, daily  |
(hourly), 3 hourly, daily 
|
| Completeness |
100% 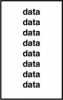 |
10 - 99%  |
| Consistency | 100% | variable |
Profiles of grid cells with simulation data and measurement data
The resolution of the grid cells depends on the model domain. meteoblue offers weather data with resolution from 3 to 30 km.
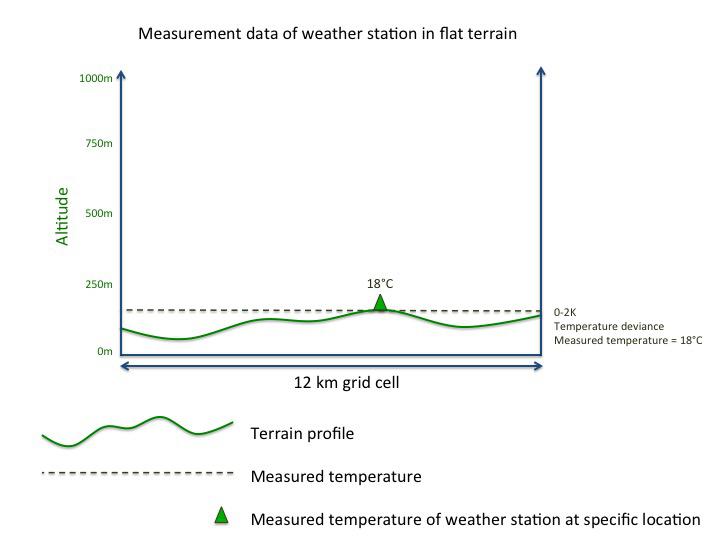
Calculation of grid cell data in flat terrain
Forecast data: meteoblue can calculate weather data for every point with a specific altitude in the grid cell.
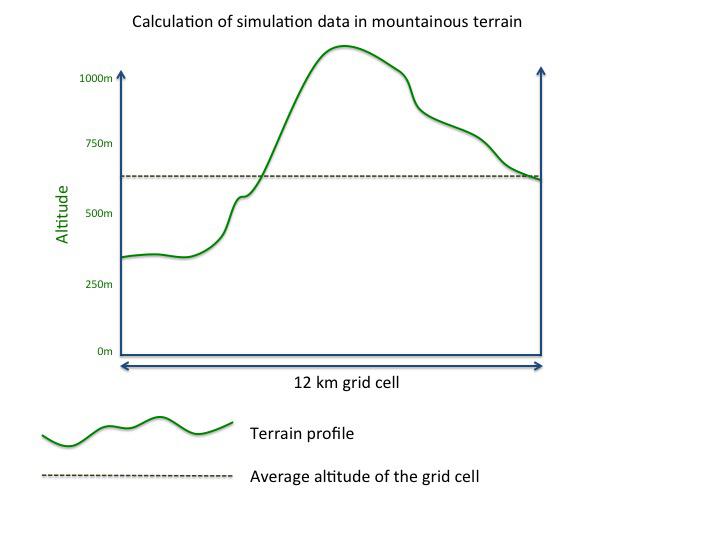
Archive data: meteoblue archives each forecast data set at least once a day. The archive data is calculated for the average altitude of the grid cell (see “average temperature of the grid cell" in the charts below). The temperature error for flat terrain is between 0 and 2 K.
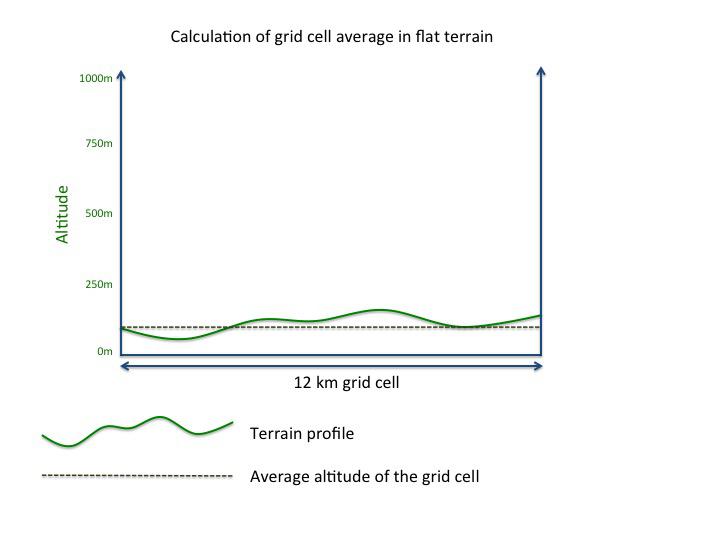
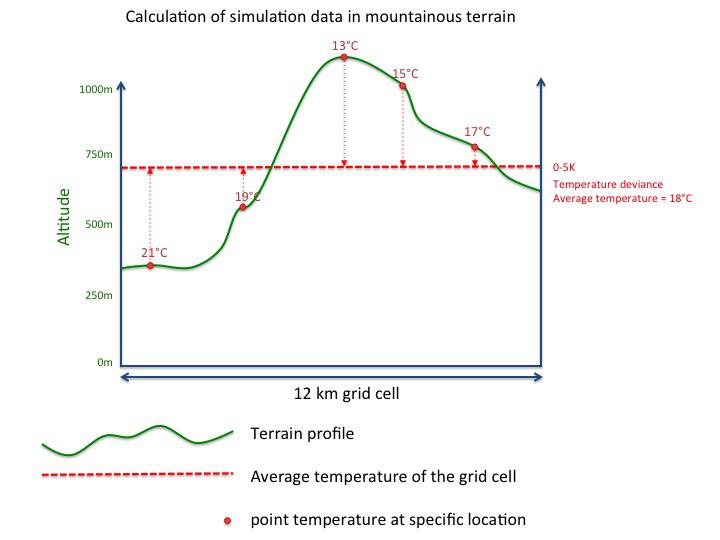
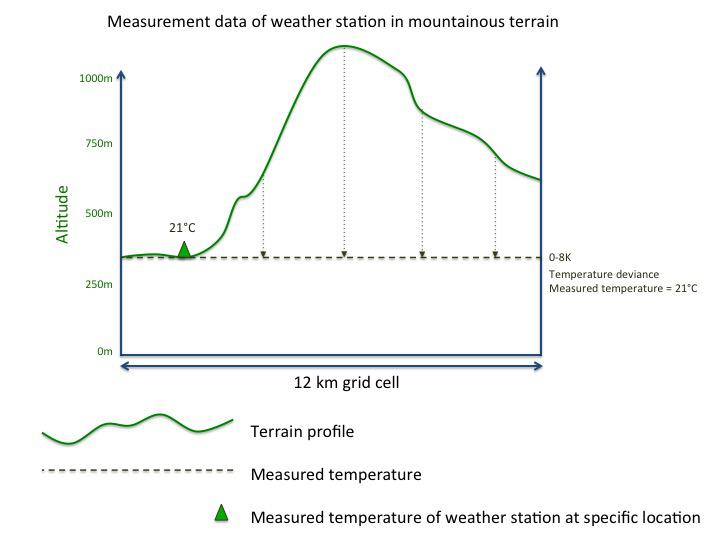
Calculation of grid cell data in mountainous terrain
Forecast data: meteoblue can calculate weather data for every point with a specific altitude in the grid cell (see “point temperature at specific location” in the charts below).
Archive data: meteoblue archives each forecast data set at least once a day. The archive data is calculated for the average altitude of the grid cell (see “average temperature of the grid cell" in the charts below). The temperature error for mountainous terrain is between 0 and 5 K.
| Flat terrain | Mountainous terrain | |
|---|---|---|
| Forecast data | Forecast data calculated for every point in a grid cell | |
| Archive data | Forecast data calculated for the average of a grid cell | |
| Temperature error | 0 - 2 K | 0 - 5 K |
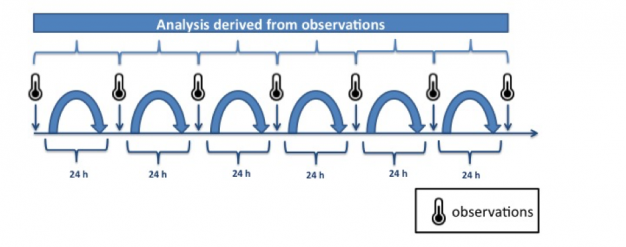
Calculation of simulation data
Forecasts can be highly inaccurate for a forecast horizon of just 10 days, so how was meteoblue able to compute more than 30 years of reliable historical data? We are able to do so, because we only forecast one day at a time, starting from real weather observations. These short-term forecasts have been validated against 10'000s of weather stations for many years and they are very close to reality, corresponding to a reanalysis dataset, which is equivalent to the best possible forecast available for the day ahead. We repeated this procedure for every day of the year for more than 30 years. That corresponds to 8'760 one-day forecasts per year, which are then joined together into a continuous time series - the meteoblue weather history.
Availability of meteoblue simulation data vs. measurement data
meteoblue simulation data is available without any gaps since 1984 from our global model (NEMSGLOBAL). This global model has a resolution of 30 km and we offer more than 30 years of hourly data.
Applications for simulation vs. measurement data
meteoblue simulations can replace measurements in most areas. A simulation will be more precise for a given place than any measurements taken 20 or more km away. In mountain areas, this distance is reduced to 3 to 10 km. In places that imperatively require high reliability, such as airports, city centres, building management, irrigation systems, renewable energy production sites, high traffic roads and others, the additional accuracy offered by measurements justify the (substantially) higher cost.

