Popular Maps
Satellite (no radar)
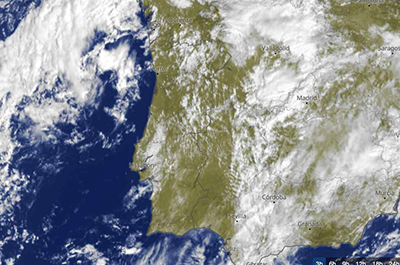
The images show most of the actual clouds; small clouds, fog, clouds at night and aerosols may not be visible. In mountain and polar areas, snow may appear as clouds. Consult the point forecast for the local details.
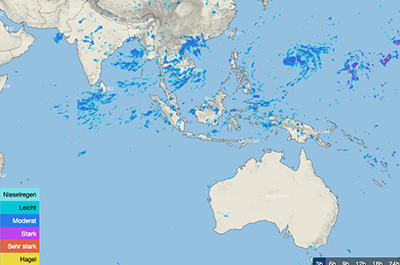
Satellite (with radar)
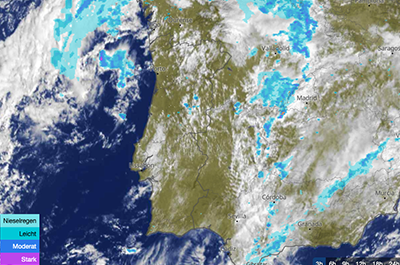
The satellite images show the distribution of the actual precipitation. These images show most of the actual precipitation in areas well covered by radar, with colours showing the intensity steps (precipitation amount). Some phenomena, such as snowfall, drizzle, low rainfall in mountain valleys or multiple thunderstorms (which may hide each other) may not be visible on the map, because remote sensing observations are also subject to errors. Consult the local forecast for more precise details on the timing and amount of precipitation expected.
Wind animation
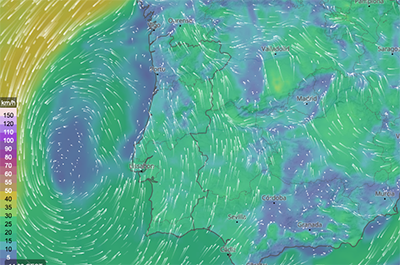
The map shows the expected wind, as average wind speed for the preceding time interval. The wind scale is uniform for all parts of the world and seasons. The wind speed is indicated with colours (Cold/Warm, Rainbow) and values when hovering over the selected area. The direction is indicated by the wind animation. You can also find wind maps higher in altitude by opening the drop-down list on the right.
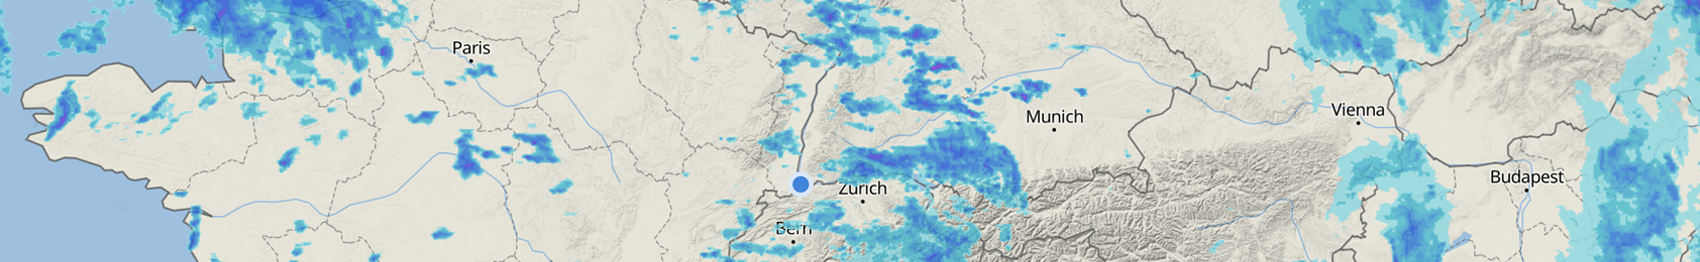
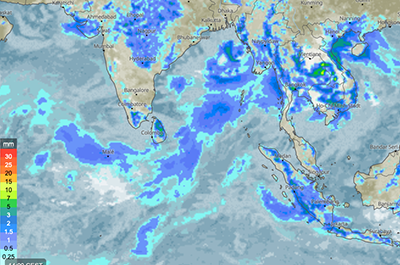
Weather radar
The weather radar shows the spatial and temporal distribution of precipitation over the last few hours. The intensity of the precipitation is displayed with colours as indicated in the map legend. In the menu you can also select a precipitation forecast for Europe (+2h) and America (+2h).
Clouds & precipitation
Clouds and precipitation map shows the amount of precipitation in the indicated time period (e.g. 1 hour) as well as the cloud cover. Precipitation in millimeters (mm) is displayed with colours as indicated in the map legend, whereas clouds are shaded in white and grey. White stars indicates snowfall. For more information, see precipitation.
Temperature
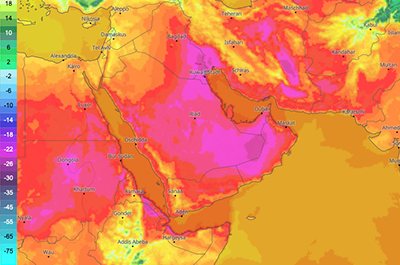
These maps show the air temperature two meters above the ground with colours as specified in the map legend. In the menu you can select whether the maximum, minimum or hourly temperature should be displayed. By adding other plots like streamlines for example, you will have the possibility to see where (warm or cold) air masses come from, for instance. For more information, see temperature.
Sunshine hours
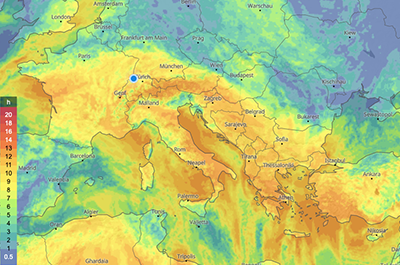
The map shows how many hours of sunshine are expected for a given location within a day. The number of hours of sunshine depends on the cloud cover, the season and the geographical location of a site. In the northern polar regions, for example, there can be up to 24 hours of sunshine in the summer months, depending on the cloud cover, while at the same time there is not a single hour of sunshine in the southern polar regions.
Wind
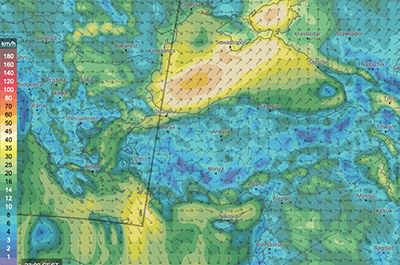
On this map the average wind speeds are shown by the colour scale and the arrows indicate the wind direction. In the menu, the desired altitude can be selected to determine the wind parameters. In addition, the map can be combined with other variables like the sea level pressure or wind animation. For more information, see wind.
Wind gust
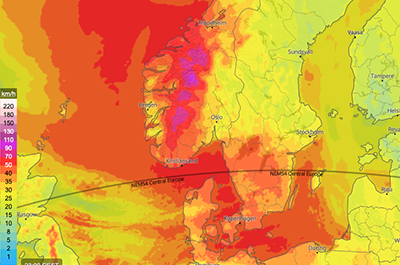
The gusts maps usually show the speed of the gusts at 10 m with colours. Hourly, maximum or period maximum wind gusts can be selected in the menu. The speed shown is the maximum forecasted speed for the selected time interval.
Relative humidity
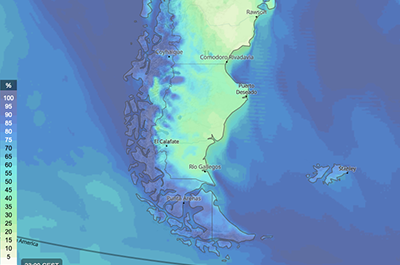
These maps show the relative humidity in percent (%) with the help of a colour scale. Relative humidity can be displayed in different altitudes. The preferred altitude can be selected from the drop-down list in the menu on the right. For more information, see relative humidity.
Precipitation probability
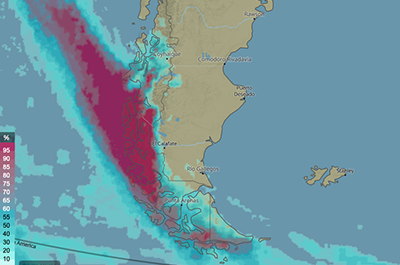
These maps show the probability of precipitation amounts greater than 0.1 mm. The probability is shown by colours in percentage (%). The colours do not indicate the precipitation amount, only the probability. For more information, see precipitation.
Weather warnings
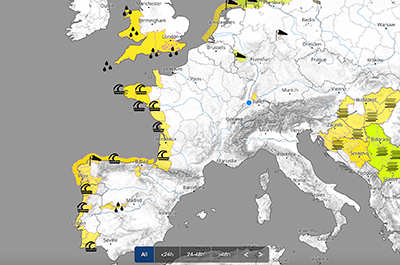
The interactive map shows the particular warnings for the surrounding areas. Clicking on each warning will open a small info box where the description of the warning can be found. The shading displays the severity of the warning. In addition, a forecast for heavy precipitation and high temperatures can be selected in the menu.

