
7-Day Weather
The meteoblue start page is the page where you arrive when looking for www.meteoblue.com and where you can have an overview of the weather forecast for a specific location.
Here you can find links to other meteoblue pages to obtain more details about the weather, the products or your own settings. At the top of the start page, you first find the Global Location Search (gray), where you can search for a specific location. On the right hand-side column you find the latest news from meteoblue.
Daily weather forecast overview
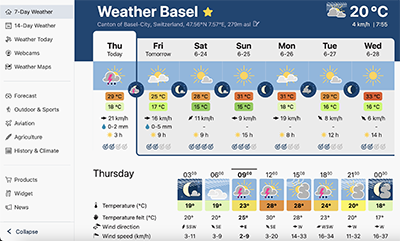
The name of the current location is written on the top left of the page, with the region, the flag of the country, the coordinates and the elevation of the place. On the right you can find the current temperature, the last update time, the wind speed and the cloud cover state. A daily weather forecast overview is presented below and is further described on the pictocast page. You can also find more details clicking on the different links below the overview:
Additional weather variables:
- For off-shore or littoral places you can find the water temperature and information on waves.
- The current pressure for the selected location is given below, as well as the hourly temperature, the wind direction with arrows, the wind speed and gust speed.
- Below these variables, the time of the last model run is shown in local time.
In addition to these variables, our simulation system produces much more data. We calculate various forecast models with more than 50 atmospheric layers and a spatial resolution from 25 km down to 700m. Each day, we generate terabytes of data and have built one of the largest existing weather databases covering the entire world. This enables users and customers to find pertinent weather information for every place on earth. The available data and images can be obtained as products through our business services.
Satellite cloud cover
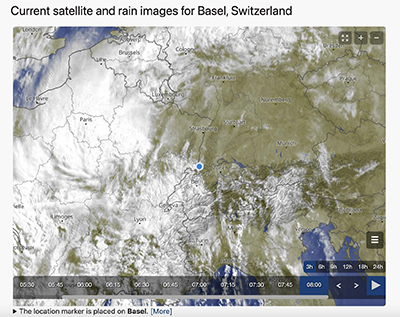
This animation shows the cloud cover as observed by satellite. High clouds and clouds with vertical development are displayed in white, low clouds and fog in grey. Orange crosses mark places where lightning was detected (over Europe). This map uses infrared satellite telemetry to calculate the temperature of the clouds. Low clouds and fog are difficult to distinguish from ground temperatures and might therefore be inaccurate. Copyright 2015 EUMETSAT / meteoblue.
Radar and precipitation nowcast
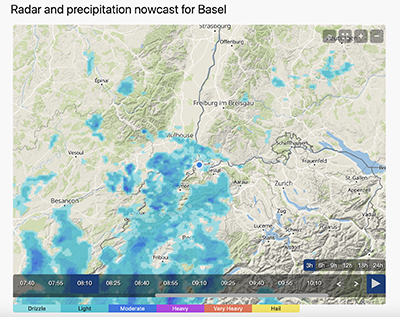
This animation shows the precipitation radar for the last 3 hours, as well as a forecast up to 2h, depending on the location. Drizzle or light snow fall might be invisible for the radar. Precipitation intensity is colour coded, ranging from light blue to heavy purple.This radar is only available for Switzerland and USA.
meteoblue maps - Wind
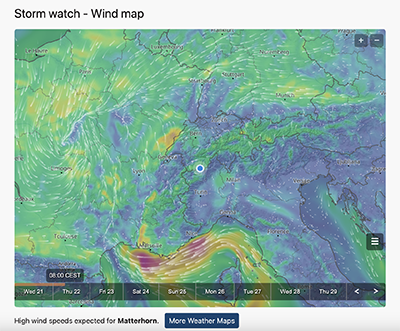
Wind streamlines are animated on top of a wind speed or temperature map. Different altitude layers can be selected in the middle-right menu. Click on the full-screen button to get a bigger view with more options.
Heat map
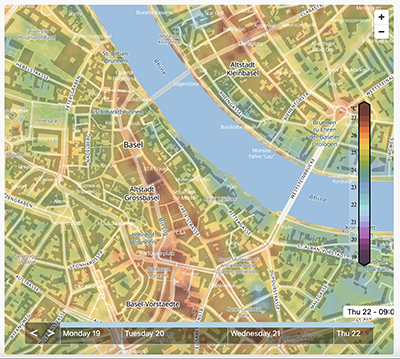
Discover a groundbreaking tool that revolutionizes urban planning and empowers citizens to find cooler areas within the city. Our state-of-the-art heat mapping feature is designed to identify local heat islands with remarkable accuracy, offering invaluable insights for city planners and individuals alike.
Ski resort information
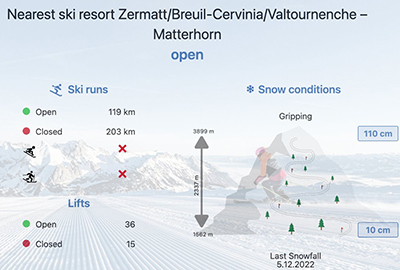
This tool is an invaluable addition to our platform, presenting meticulously curated details about the local ski resorts, which are created by combining up-to-date ski information with trustworthy weather data. Seamlessly integrated into our start page, it allows our users to explore nearby ski destinations based on the chosen location. The tool consists of a dedicated box summarising key resort information, such as in-depth details on slopes, infrastructure, updates on open runs and lifts, current snow conditions (such as comprehensive snow maps showcasing snowfall and depth data, or our Snow meteogram), contact information, and website links for each resort.
Settings
Personal settings, such as language and units for temperature and wind can be changed under "Language & Settings" (Main page top bar). If you enable Cookies from www.meteoblue.com in your web browser, these settings remain with each new site visit. Further personal settings can be obtained after Login.

