
rainSPOT
Regional overview of precipitation
The rainSPOT shows precipitation in the surrounding of the selected location for the time interval (hours) preceding the indicated time. If the rainSPOT shows intervals of 3 hours (e.g. 08:00, 11:00, 14:00...), the rainSPOT for 11:00 shows precipitation from 08:00 to 11:00. The details of precipitation (amount, probability, time, etc.) are usually described above the rainSPOT, in the pictocast.

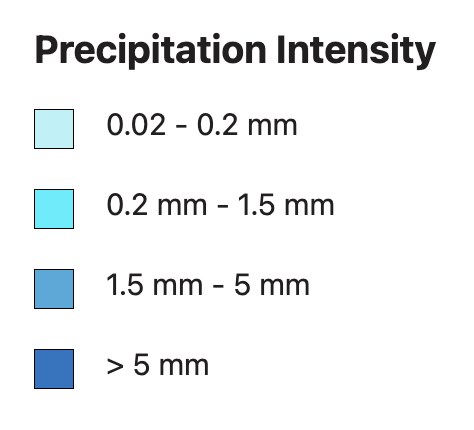
The rainSPOT works like rainNOW, with an aggregation of grid cells so that the one with the selected location is in the middle of the spot. The position of the location is not always in the center of the grid cell, what means that you can be a few meters or kilometres away from the center of the spot according to the model resolution. Thereby, you are always in the center grid cell - no matter which location you select, even in the mountains or on the sea. The meteoblue models with global coverage allow you to find a regional view for any place in the world. The radius of the outside circle is indicated on the left of the spot. The colour legend is shown here on the right.
Precipitation may fall as drizzle, rain, hail, ice or snow. More information about the conversion of water equivalent into snow height is available on our precipitation page.
The rainSPOT is a meteoblue invention. meteoblue first published the rainSPOT in June 2008, and has since made the rainSPOT available for every location in the world. Until the end of 2013, no other weather service has been able to copy this unique presentation format for live website queries.
rainSPOT shows precipitation - spot on!
Applications and particularities
The rainSPOT shows the distribution of expected rainfall around the selected place, and thus allows for better
recognition of possible developments. By means of the distribution, it is possible to identify the expected
precipitation pattern:
• Persistent, lasting precipitation, as in the the center of low pressure zones, or
during the monsoon season in tropical areas;
• A precipitation front, which passes over the selected
place;
• Thunderstorms, with a short, spatially limited rainfall activity;
• Showers, which fall with
irregular distribution, or especially at higher altitudes;
• Individual, punctual precipitation that is
triggered by specific events (such as downburst), or even by (sometimes also wrong) local measurements.
In the high mountains, precipitation often occurs very locally (on hillsides or on summits), whereas the rainSPOT
will show it in a 10 (or 12)-km grid cell for the whole area. Precipitation may, however, fall only in parts of that
area. For example, a quantity of precipitation of 1 mm for 10 x 10 km may indicate, that precipitation of 1 mm falls
in the entire area, or that 2 mm fall on half of the area (and nothing in the rest), or that 10 mm fall on one tenth
of the area (and nothing in the rest), or that 100 mm precipitation fall on one hundredth of the area (and nothing
in the rest), depending on the type of precipitation and of the terrain.
In areas with radar or satellite detection of precipitation, rainSPOT (and
meteogram) data will be adjusted using the most recent precipitation measurements available.
In Europe and North America, the spatial resolution for the first 3 days is 3-4 km, and therefore different from the more wide-range resolution of 12 km for the forecast from day 4 to 7. It may also change in other areas, depending on models currently used.
This should be considered when interpreting forecasts, especially in hilly areas and over several days ahead.

