
Meteogram 5-Day
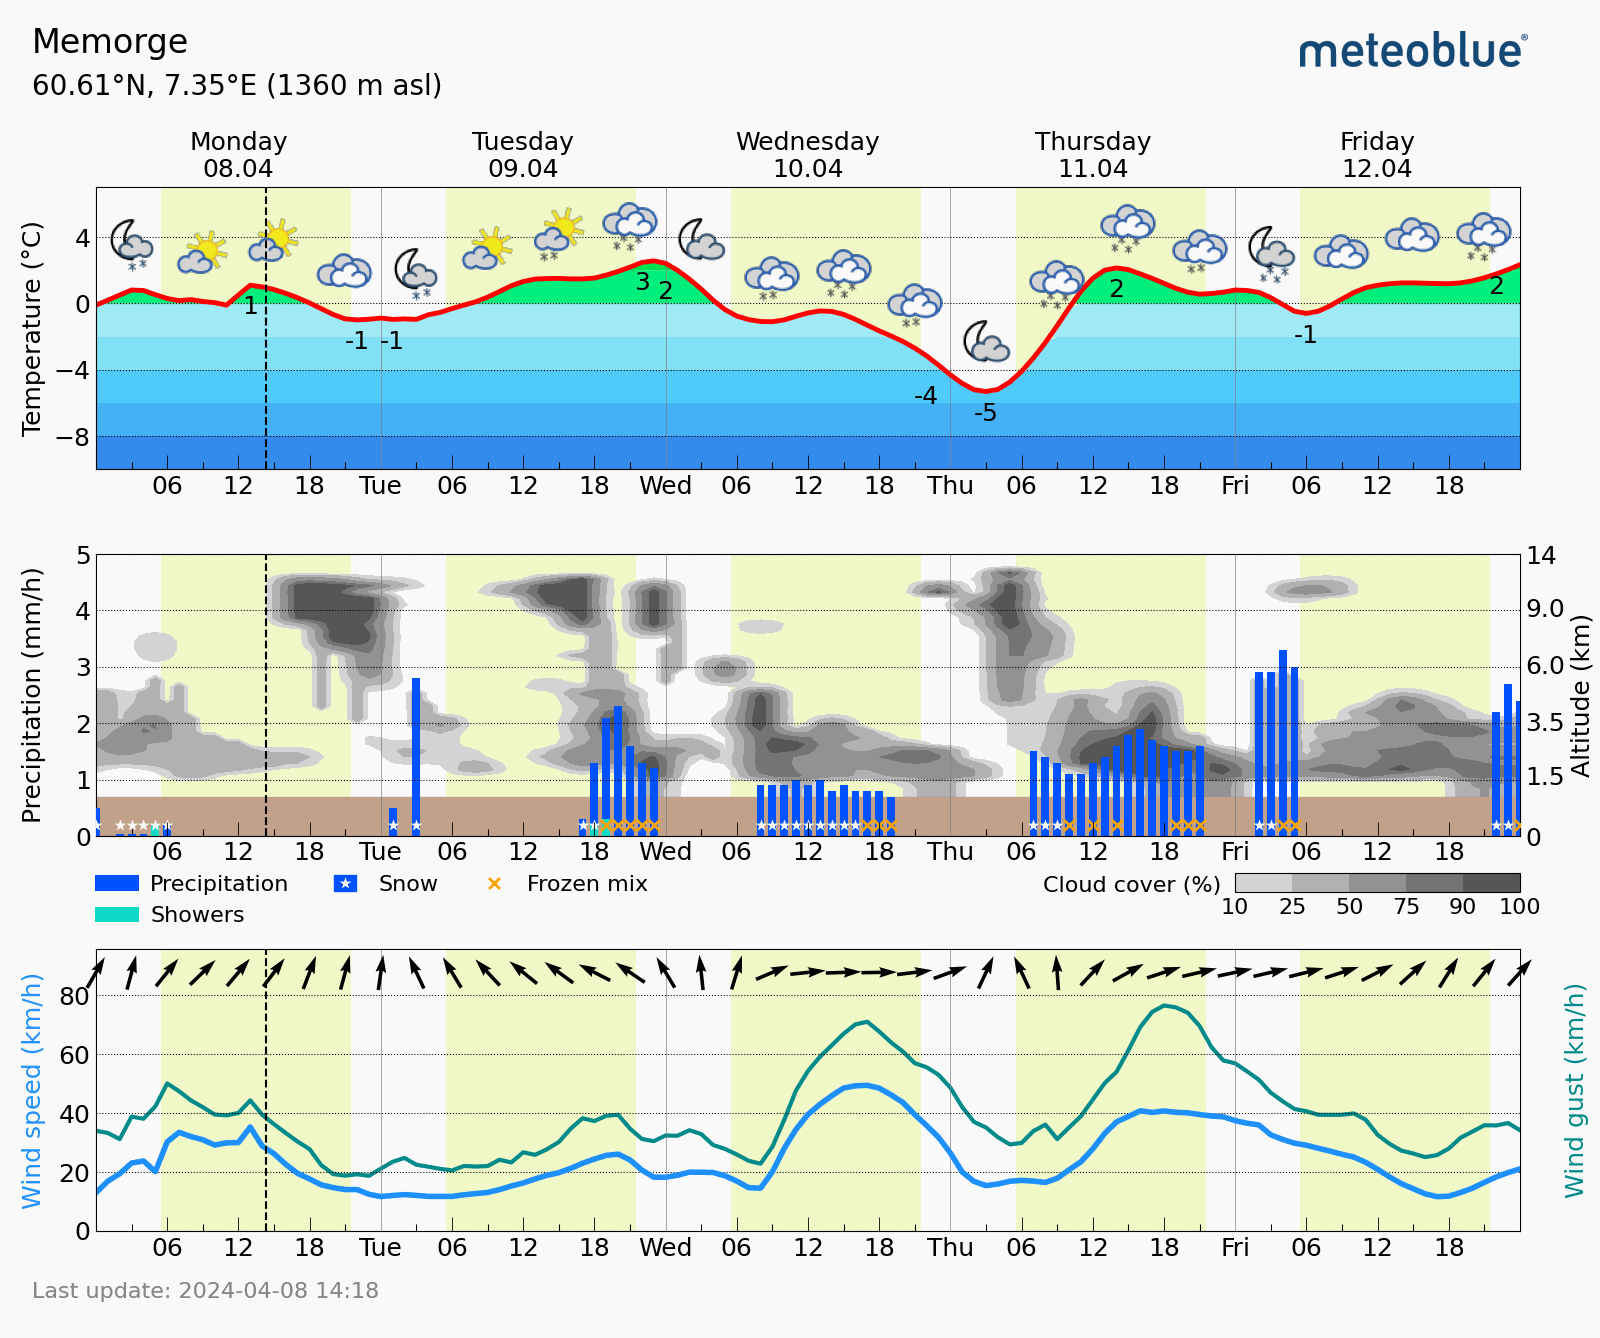
You can find the Meteogram 5-Day for the selected place on the meteoblue start page. This meteogram displays three different diagrams.
The weather data in the meteogram are calculated with our meteoblue Learning MultiModel (mLM) considering several different data sources.
The first one shows a coloured temperature curve in hourly steps and pictograms for the weather condition in steps of 6 hours.
On the second diagram, clouds are shown with various densities (light to dark gray) and altitudes up to 14 km asl (above sea level). Rain (blue) and showers (light blue) are presented as a bar graph at the bottom, showing the quantity of water (mm). A star "*" marks snow and exclamation marks "!" freezing rain. A brown bar shows the altitude above sea level of the grid cell containing the location.
The last diagram shows wind direction arrows (in 2 hour intervals), mean wind speed (light blue curve) and gust wind (dark green). In each of the diagrams, the yellow background colour shows daylight, and the white background represents night.
In mountainous terrain, a horizontal brown bar is shown, which represents the average altitude of the area in this meteogram.
For commercial use, please consult the product page meteoblue API.

