
Sea & Surf
You can find the Meteogram Sea & Surf on the meteoblue website. The meteogram shows information needed for outdoor activities close to the sea such as sailing or surfing. It is only available for locations, which are close to the sea. Each of the diagrams also shows the day length in yellow as well as the night in white in the background.
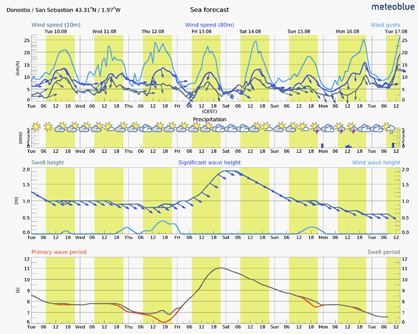
The meteogram displays four different diagrams:
The first diagram shows wind direction arrows and wind speed for 10m (grey line) and 80m above ground (dark blue). The light blue line represents gust wind.
Wind speed is the average of all wind speeds calculated for each model interval of the previous hour whilst wind gusts is defined as the highest wind speed of all calculated model intervals of the previous hour.
The second diagram indicates precipitation amounts and the weather conditions are graphically summarised by pictograms. These show sunshine, clouds, precipitation type, intensity and thunderstorms for the time period referenced in the forecast.
The third diagram indicates the significant wave height (dark blue), the swell height (grey) and the wind wave height (light blue). The y-axis shows the height in metres. The significant wave height is the average of the largest 33% of all waves (including wind and swell waves) in metres (m) over a recording time period. It corresponds to the wave height a skilled observer would see. Since wave heights are average numbers, some individual waves can be much higher.
Swell waves are generated by wind far away and may have travelled very long distances (1000's of km), whereas wind waves are caused by the local wind.
The arrows indicate the wave direction. The wave direction is defined as the direction from which the wave comes, using the same conventions as for wind speed.
On the fourth diagram, primary wave period (red) and swell period (grey) are shown. The y-axis shows the time in seconds.
For commercial use, please consult the product page meteoblue API.

