Precipitation maps
Precipitation maps allow you to see the amount, distribution, type and probability of precipitation over a large area. Precipitation maps can be combined with sea level pressure, wind animation and the graticule by activating the different options in the lower right corner, with one click.
Accumulated precipitation
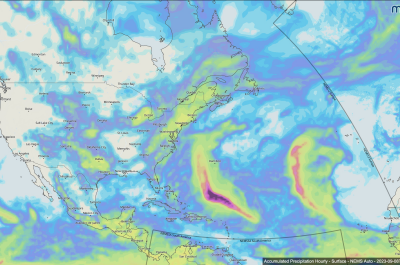
This weather map accumulates precipitation amounts (in mm) for a selected time. The accumulation hours can be selected in the time slider at the bottom of the bar. Precipitation accumulations are available for the next 12 to 168 hours. For example, the 168-hour map shows the accumulated precipitation amount expected to fall in the next 168 hours.
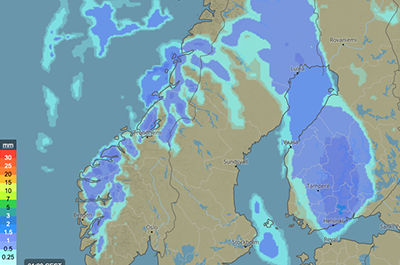
Daily precipitation
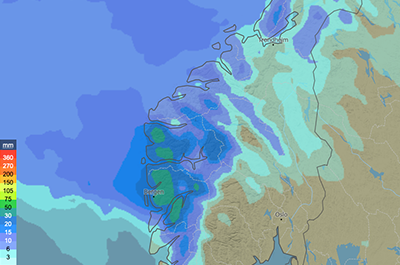
This map shows the predicted amount of precipitation within one day. The amount of precipitation is expressed in millimeters (mm) and coloured as shown in the map legend.
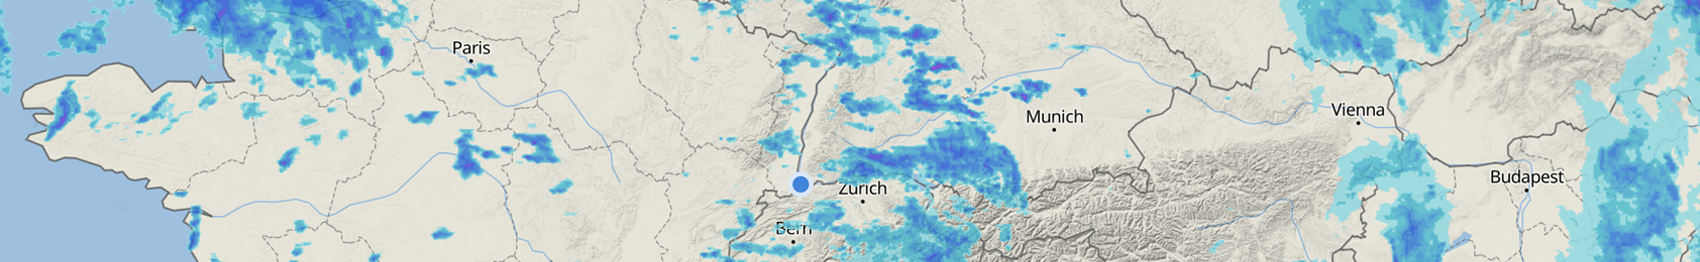
Hourly precipitation
This map shows the forecasted precipitation amounts in millimeters (mm) within a certain time period. In the menu you can choose between hourly, 3-hourly and 6-hourly precipitation values.
Accumulated snowfall
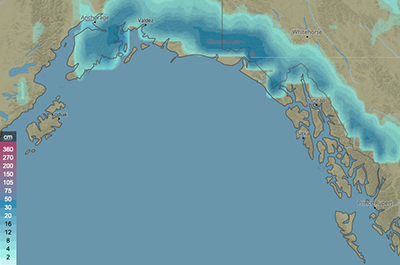
These maps show the accumulated snowfall amount within the indicated time period (e.g. next 6 hours). The amount of snowfall is expressed in centimetres (cm) and coloured as shown in the map legend. For more information, see snow.
Daily snowfall
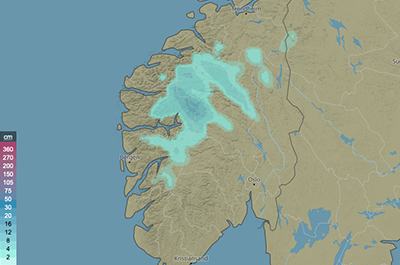
This map shows the predicted amount of snow within one day. The amount of snow is expressed in centimetres (cm) and coloured as shown in the map legend.
Hourly snowfall
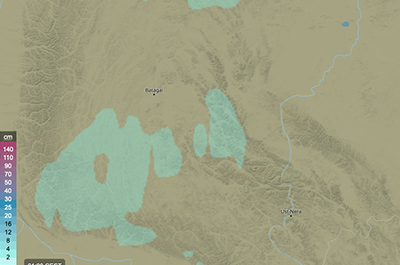
This map shows the forecasted snow amounts in centimetres (cm) within a certain time period. In the menu you can choose between hourly, 3-hourly and 6-hourly snow values.
Snow depth
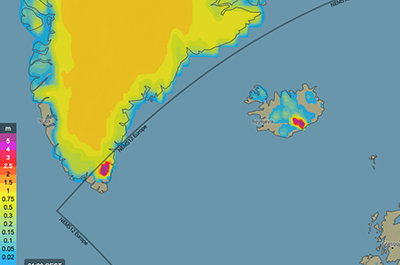
The estimated snow depth maps show the total amount of accumulated snow on the ground as an estimate. It is expressed as a height in metres (m). The snow depth may vary substantially within small areas, as a function of snowfall, wind, slope, exposition, ground and other parameters. The height is therefore to be understood as an indication. Actual conditions can be checked under the Meteogram Snow. More information: see Snow.

