
Climate Analysis
The meteoblue Climate Analysis provides an easy-to-read graphical summary of complex climate change simulations
for any location on Earth until the end of the 21st century.
Predicted variables such as air temperature, precipitation, and other derived variables
(e.g., number of hot days or tropical nights) are available for each RCP emission scenario.
Note that these are synthetic data, i.e., they are to be used for statistical applications
but NOT to forecast the weather for a specific moment in time (e.g., 21st January 2071 10:00 UTC).
Different boxplot graphics for 30-year and 10-year time periods enable the users to assess the uncertainty range.
Yearly aggregations
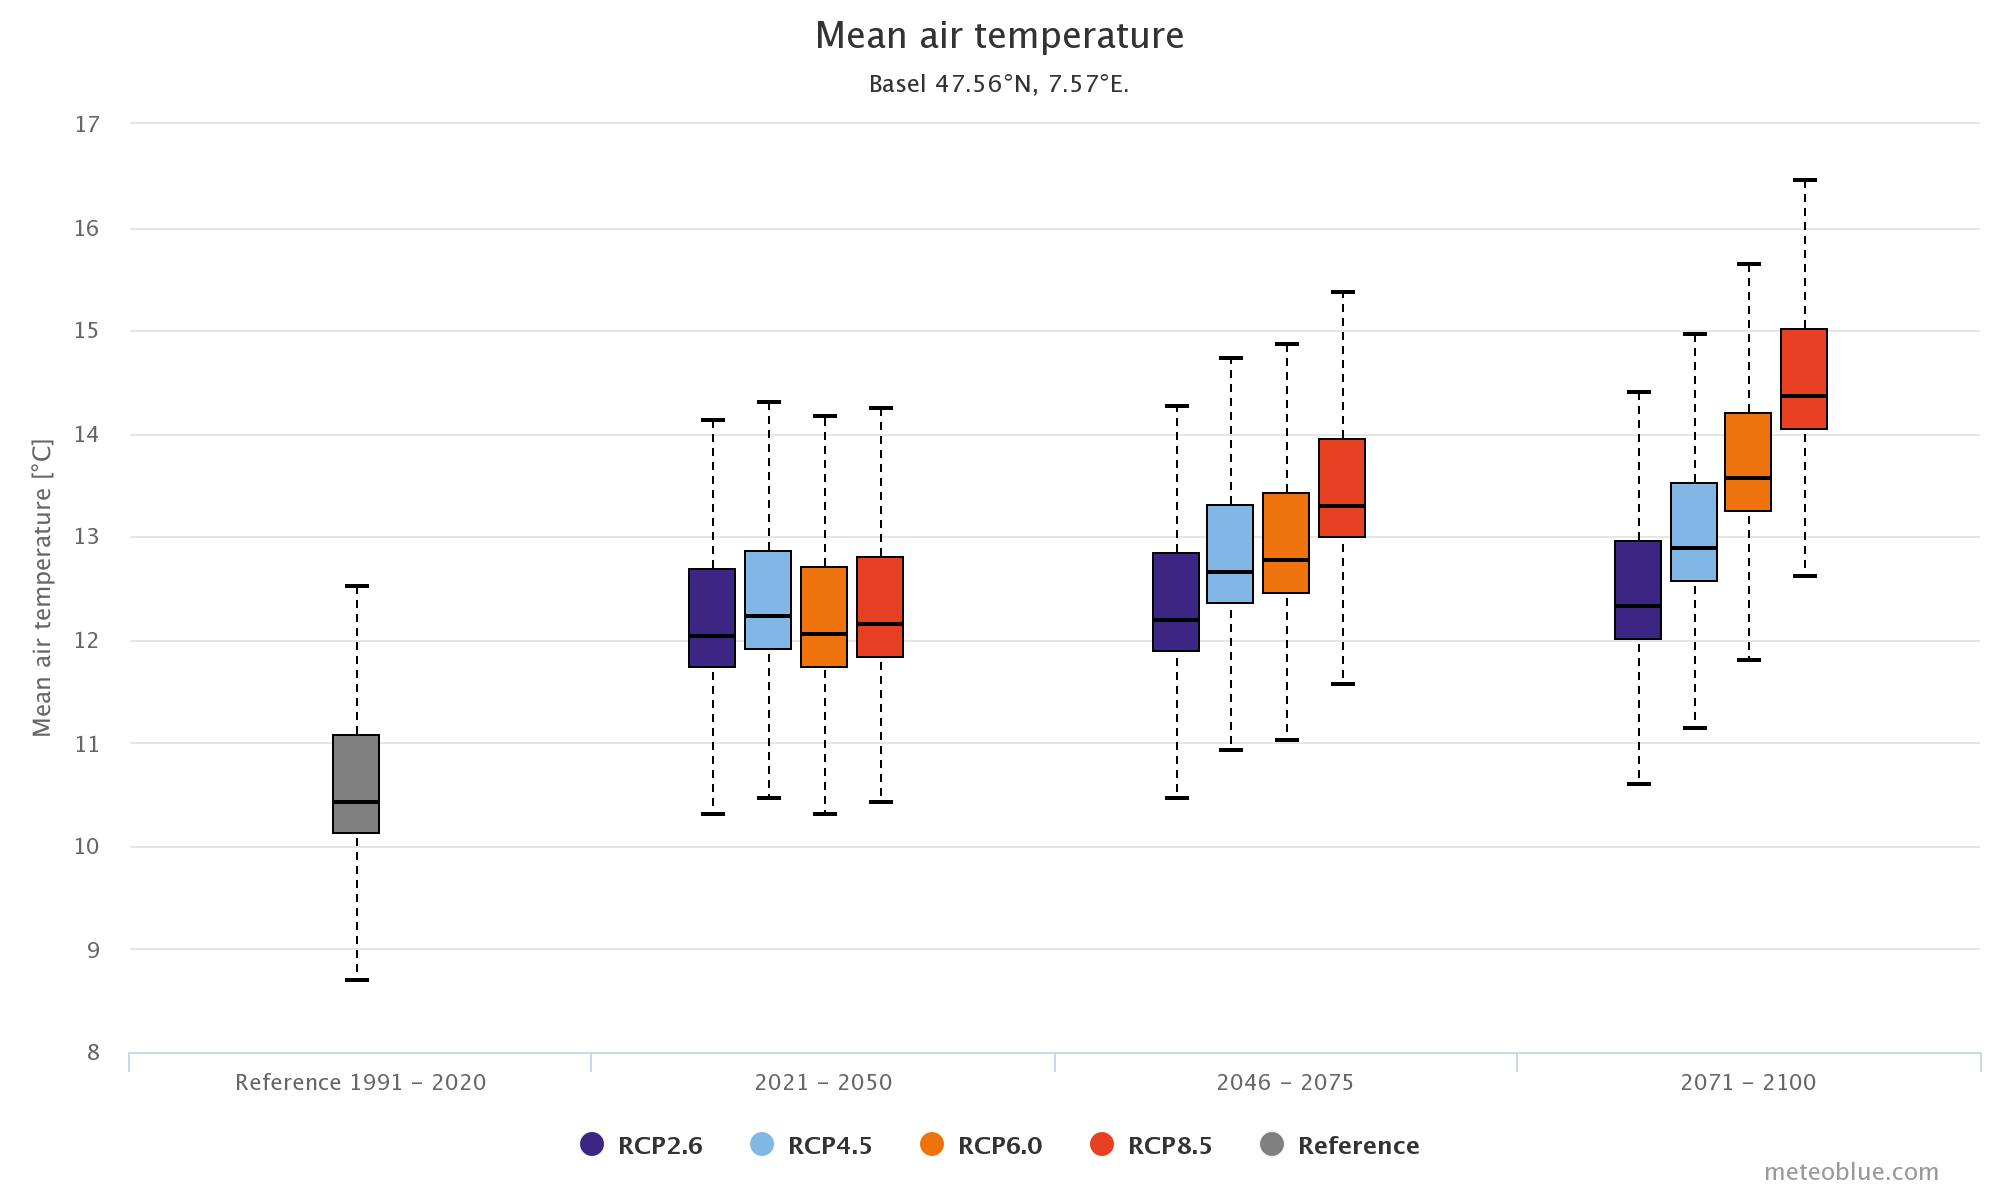
This diagram visualises the yearly averaged mean air temperature for four different time periods (reference period, 2021 – 2050, 2046 - 2075, 2071 – 2100), and for the four main emission scenarios (RCP2.6, RCP4.5, RCP6.0, RCP8.5; see the colour-coding below the diagram) for Basel (CH). The boxplots in the diagram show the variability within the selected period and represent typical and extreme meteorological years.
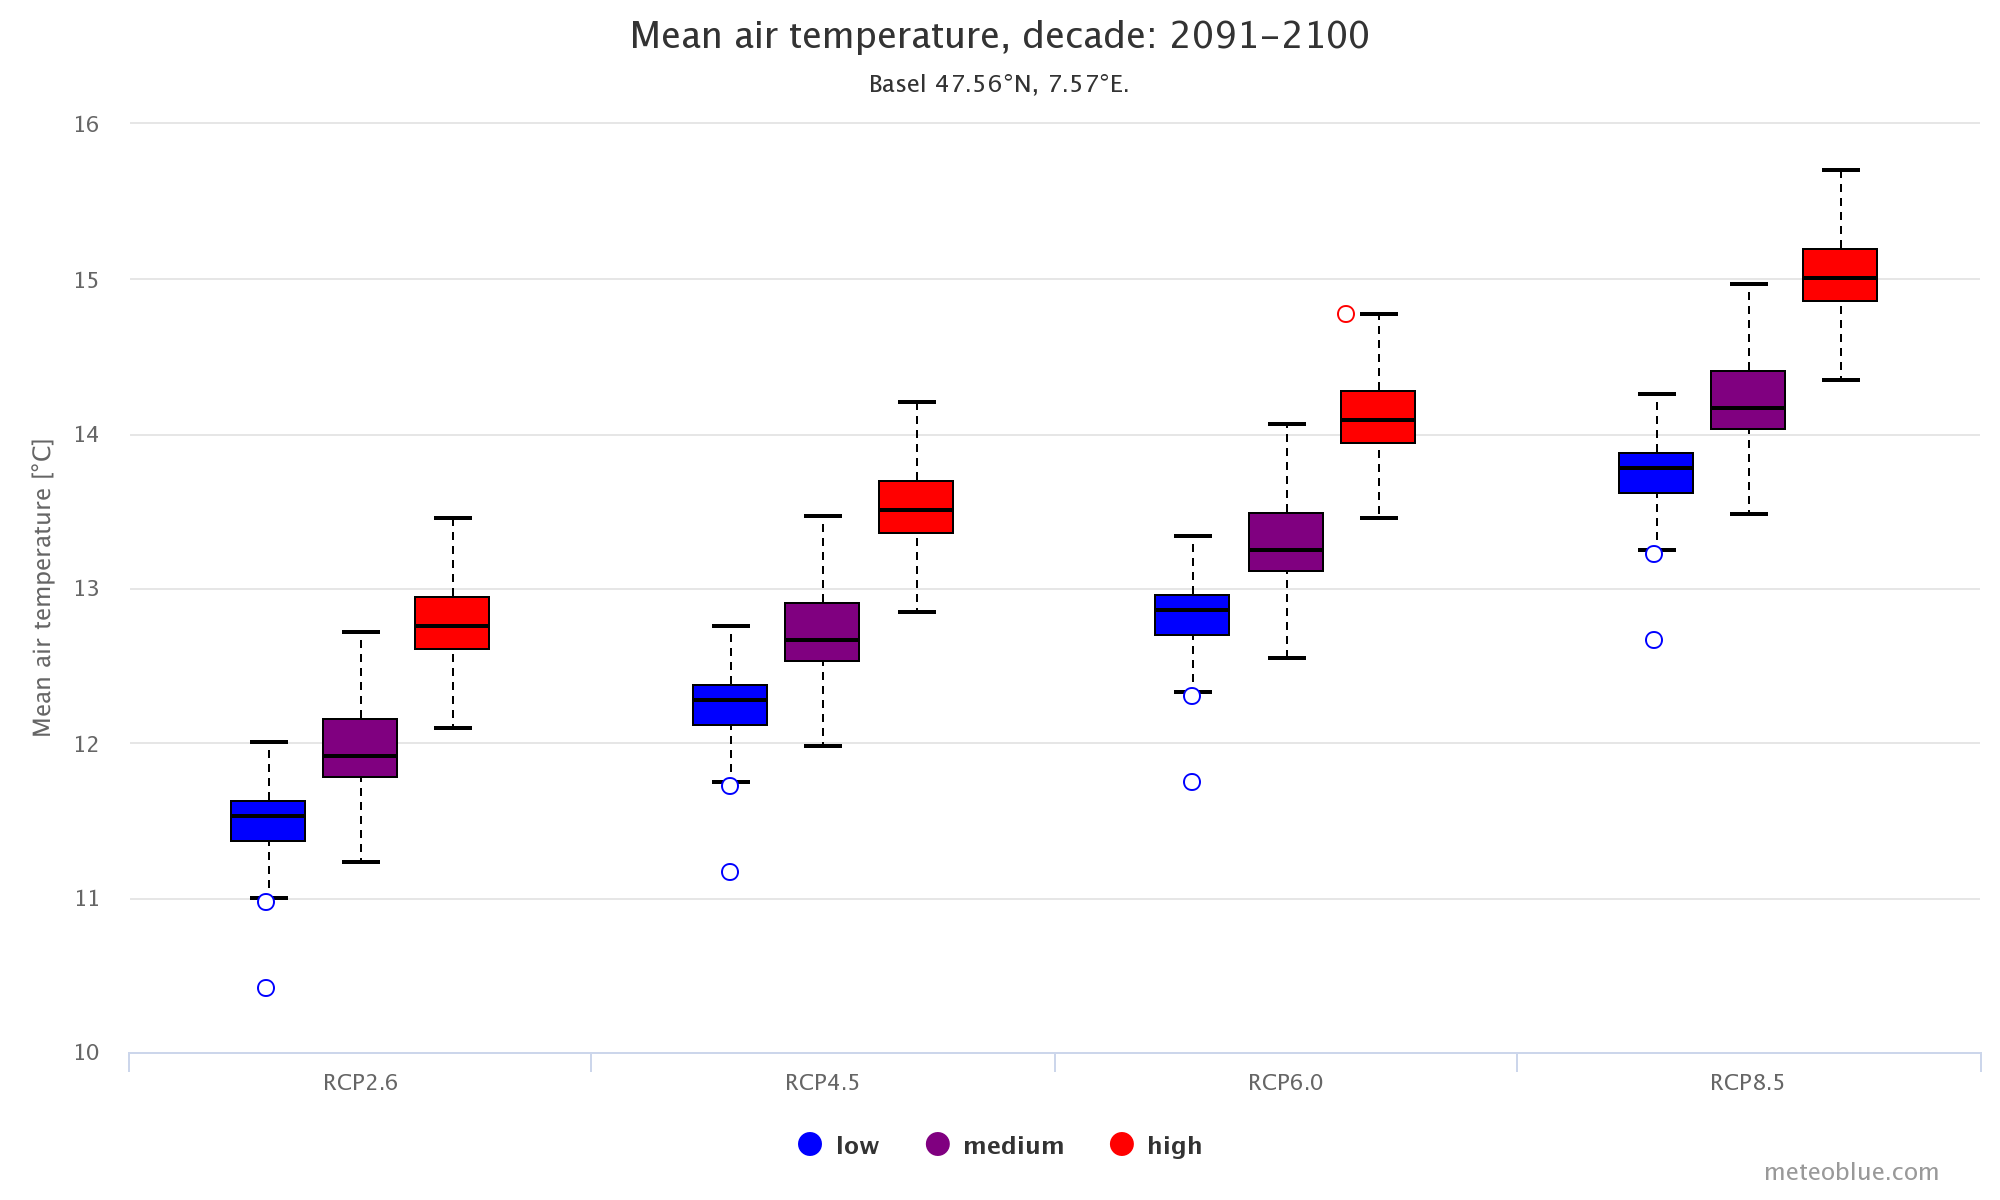
This diagram indicates the yearly averaged mean air temperature for four different emission scenarios (RCP2.6, RCP4.5, RCP6.0, RCP8.5) for the period 2091 – 2100 for Basel (CH). A “Low”, “Medium” and “High” scenario is calculated, based on the classification of a 30-year reference period in “Low”, “Medium”, and “High” yearly mean air temperatures. The boxplots in the diagram show the variability within the chosen period, and represent typical and extreme meteorological years.
Monthly aggregations
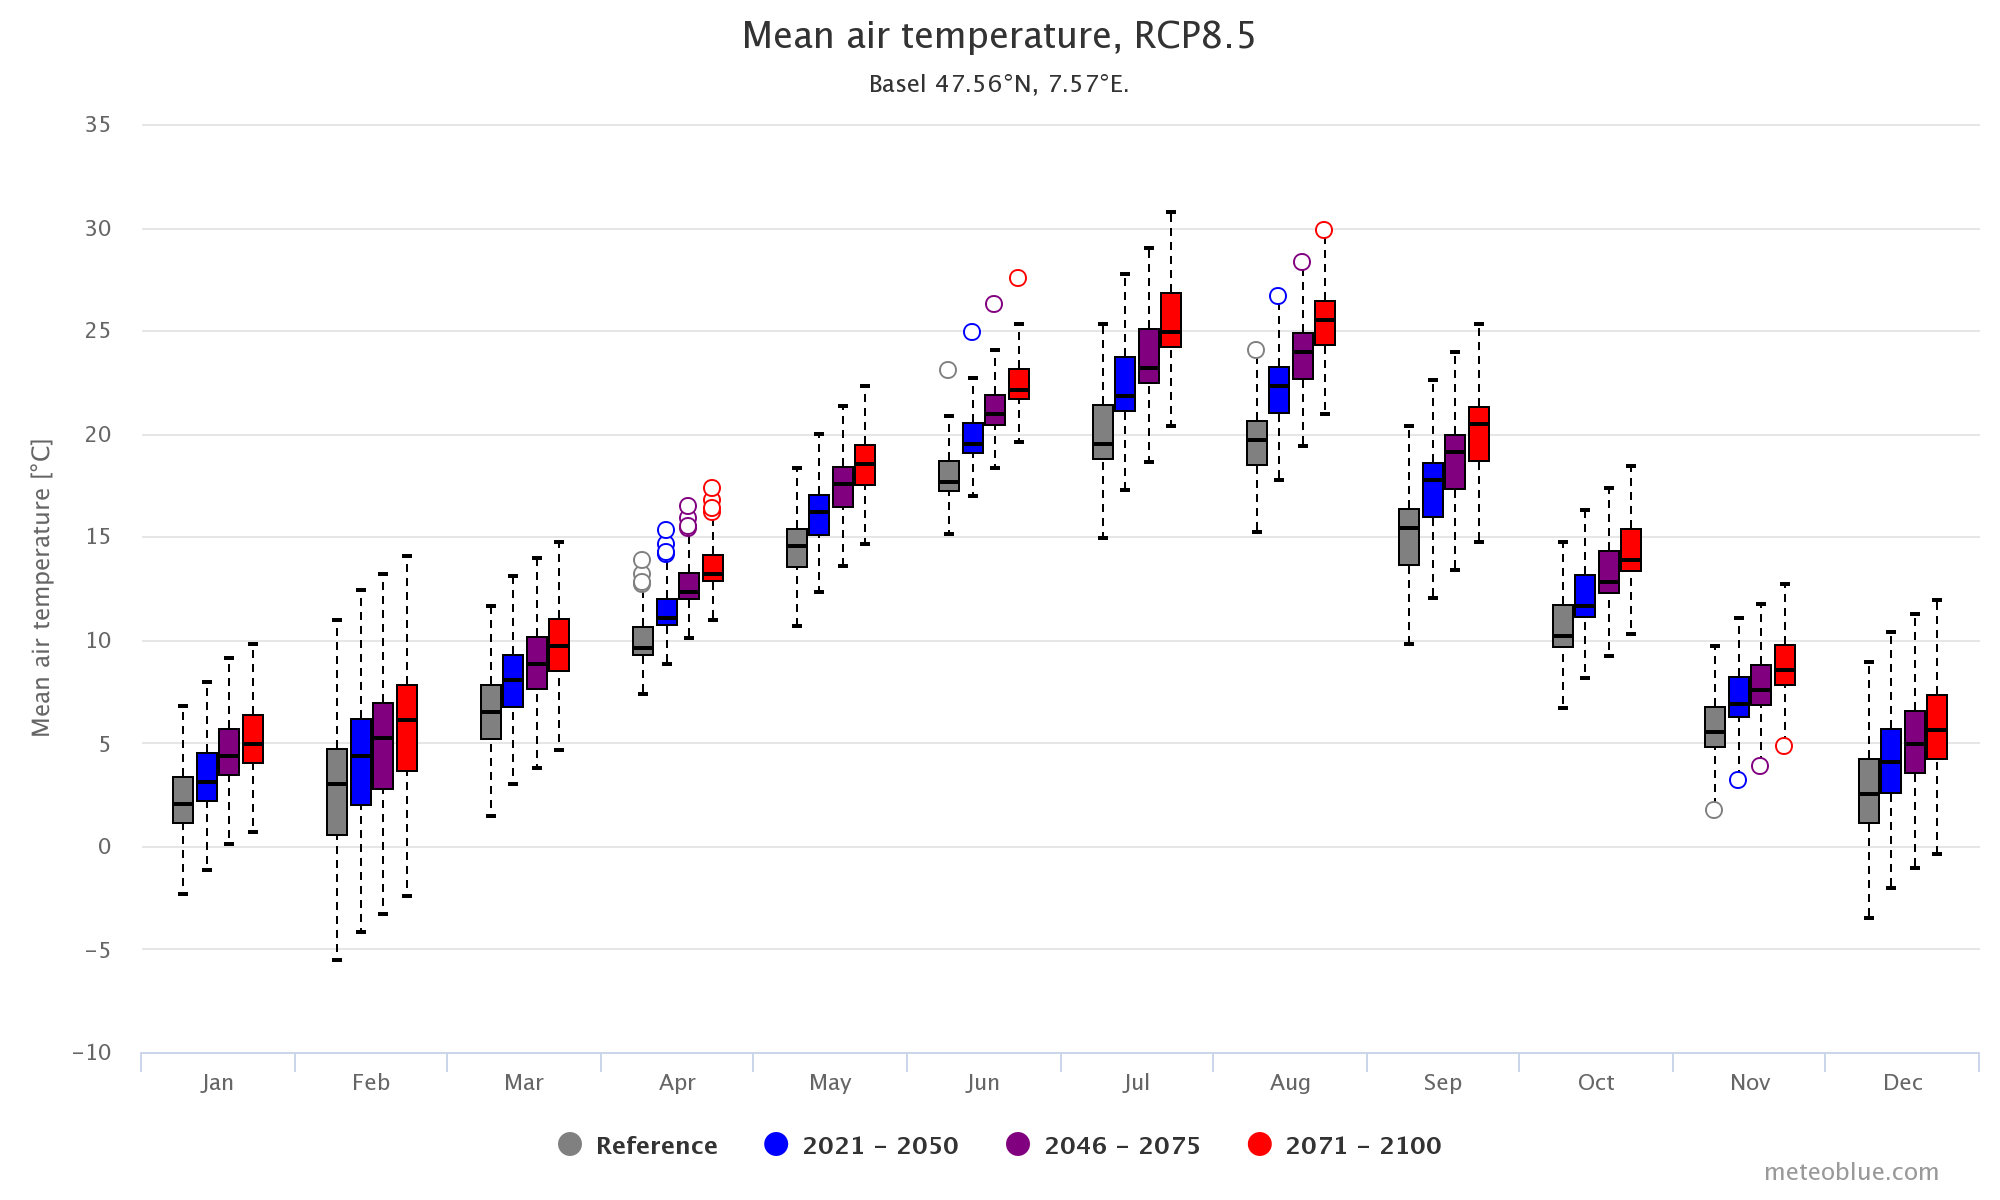
This diagram displays the monthly averaged mean air temperature for four different time periods (reference, 2021 – 2050, 2046 - 2075, 2071 – 2100; in different colours) for the RCP8.5 emission scenario for Basel (CH). The boxplots in the diagram show the variability within the chosen period, and represent typical and extreme meteorological months.
This diagram shows the monthly averaged mean air temperature for the RCP8.5 emission scenario for the period of 2091 – 2100 for Basel (CH). A “Low”, “Medium” and “High” scenario is calculated based on a classification of a 30-year reference period in “Low” “Medium”, and “High” monthly mean air temperatures. The boxplots in the diagram show the variability within the chosen period, and represent typical and extreme meteorological months.
Consultation on climate data
climate+ subscription comes along with a free-of-charge monthly webinar, in which we answer users’ questions, recommend suitable options on how to integrate the data into different platforms, and explain the physical limitations of the dataset. Contact us in the free monthly webinar if you have further questions regarding the dataset.
Try meteoblue climate+ Climate Analysis for Basel free of charge.

