
Histogram
The histogram is part of the history+ offer and displays the occurrences of values or value classes in a given time range. Thus, different seasons can be easily compared and there is also the possibility to create a high-resolution graph. The histogram uses aggregated historical weather simulation data, which are available for the whole world since 1940.
The upper box indicates the time period for which the diagram is shown. You can switch to other locations by clicking on the location name (right box) and compare data with the current location. This is only possible for more than one activated history+ location.
The histogram is available for the weather variables, which can be selected below the diagram, such as temperature (2m), relative humidity (2m), sea level pressure, precipitation amount, snowfall amount, wind speed for different altitudes (10m, 80m, 900hPa) and wind gust (10m).
It is also possible to choose multiple weather variables at the same time to be evaluated in one diagram.
The standard units are automatically chosen, whereas other units are also available.
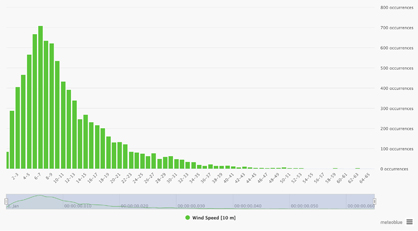
The x-axis displays the classification of the selected weather variable and the resolution depends on the value classification. The value resolution defines the number of bars displayed. The higher the resolution, the more bars are being shown. For instance, a value resolution of 5 categorises data in value steps of 5 (0- 5km/h, 5- 10km/h,…).
The y-axis shows the frequency of the occurrence of a pre-defined event and therefore, the more often a certain weather variable is being quantified, the longer the bars.
An example is that if the temperature bar for 20°C is longer than for 25°C, the frequency of 20°C is higher than for 25°C and therefore, the temperature event of 20°C occurs more often than the 25°C event. With the mouse over function, the aggregated values for the selected weather variable are shown.
Additionally, the weibull distribution is available for wind speed and wind gust. To get access to the weibull distribution, place a tick in the respective box.
The weibull distribution is a continuous probability distribution indicating the probable density distribution of the wind speed. The curve shows the frequency of different wind speeds.

