
Year comparison
You can find the year comparison meteogram on the meteoblue website as part of the history+ offer.
history+ offers immediate access to the global weather simulation database.
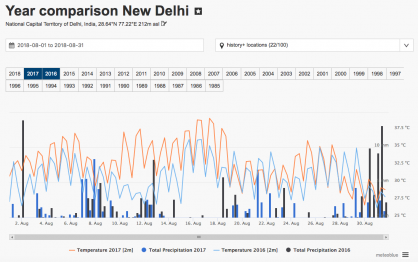
The year comparison is based on historical weather simulation data and shows the development of weather variables during a year and compares them with other years. Data are available in hourly and daily resolution.
The upper part of the diagram displays the selected location. The global location search allows you to search for locations in the whole world. Once the desired location is selected, history+ can be enabled and you can use the year comparison. In the upper right box, you can switch between the enabled history+ locations.
The upper box on the left side indicates the time period for the year comparison. You can choose the different years to be analysed in the diagram - either one year or several years.
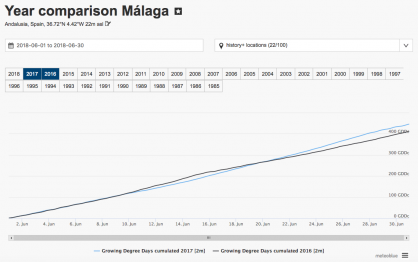
Weather variables: Below the diagram, the different weather variables are listed. You can choose the weather variables needed by ticking the boxes. The following weather variables are available for this diagram: temperature, growing degree, relative humidity, pressure, precipitation amount, snowfall amount, total cloud cover, low, mid and high cloud cover, sunshine duration, solar radiation, wind speed (10m, 80m, 900hPa) and wind gusts (10m).
When selecting growing degree in the variable list, the parameter for growing degree has to be defined on the left side:
- Growing degree days: Growing degree days are days on which the heat accumulation leads to a certain outcome such as a blooming flower or the emergence of an insect from dormancy. These variables are used for the prediction of crop development or maturity.
- Heating degree days: Heating degree days calculate the demand for energy needed. Above a certain temperature, a building does not need heating.
Once all parameters are selected, a graph is generated. By scrolling over the graphs you will get information about the selected weather variable for a certain date. Clicking on the weather variable description below, the diagram disables certain weather variables or years.
The standard data units and time zones are automatically filled in. There is the possibility to accumulate data. The accumulation of temperature values is usually applied to calculate growing degree days. You can also select a time zone for the location. Local time is set as per default but data are also available in UTC time. Temperature is expressed in degrees Celsius (°C) as well as in degrees Fahrenheit (°F). For wind speed, there are the units kilometres per hour (km/h), metres per second (m/s), knots (kn), Beaufort (bft) and miles per hour (mph).

