
Measurements
Weather (also called meteorological) measurements have allowed a scientific base for determining and comparing weather information, and have been improved steadily since the 18th century. Measurements can be made for meteorological variables, such as temperature, wind speed, precipitation, and others.
The point measurements mainly originate from:
- ground weather stations, as displayed for example on the temperature °C maps
- weather balloons ("radio-soundings")
- buoys (weather stations on the water)
And for more specific informations, such as cloud cover, water vapour, etc, observations may also be retrieved from:
While until the late 20th century, measurements generally had to be conducted manually, most have been automated since 2010, enabling measurements of more variables, in more frequent time intervals, with higher accuracy and with easier access to the data.
Despite great improvements, it is estimated that measurements remain available for less than 1% of the Earth's surface. The graph below shows the coverage of the land surface by measurements, assuming a measurement is representative for the surrounding area of 50, 25, 12, 3 and 1 kilometre in diameter.
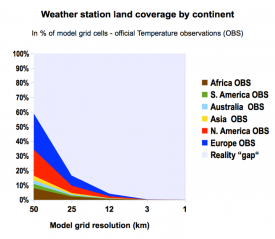
Even if 50 km diameter is deemed represented by the measurement of a single station, the weather information coverage of the Earth's land surface would still be less than 50%. If weather conditions (such as temperature, wind, precipitation, etc.) change every 3 km, then less than 1% of the land surface is covered by measurements. In Europe, only 0.3% of the land are covered by weather stations and only 0.04% in Africa. If a global diameter of 50 km is used, then 60% of Europe and only 8% of Africa are covered.
With numerical modelling (simulations), 100% of the world may be covered, and several weather events occurring in different parts of the worls simultaneously, thanks to NMM technology. The accuracy of the information generated depends on the resolution and the variables calculated. Thanks to weather models, we can now understand weather conditions in most places of the Earth much better than before. Furthermore with the daily calculation of models, it is possible to visualise the weather situation in any place in the world.
Measurements are used to initialise models, to validate the model output at places where reliable measurements are available and to improve specific model output, if a better accuracy for one specific point is required. meteoblue continuously compares measurement data with the results of the model, and applies post-processing to improve specific variables. If the difference between the measurement and the forecast is larger than expected, please inform us.

