Symbols and Pictograms
This section shows and explains the symbols we use.
Location symbols
The symbols used for location categories are explained under location attributes.
Risk symbols
The risk symbols are described for the risk map.
Wind barbs
Here you find the explanation for the wind barbs showing the speed and direction of wind that are used in meteograms and maps.
Pictograms
Weather conditions are graphically summarised by pictograms. These show sunshine, clouds, precipitation type, intensity and thunderstorms for the time period referenced in the forecast. A detailed symbol description is shown below. Pictograms are used in overviews like on the start page and in meteograms. The period for which the pictogram is effective is printed above or below. An hour indicates the end of the interval (e.g. a 3-hour pictogram marked 11:00 includes the forecast from 8:01 until 11:00, and the following 3-hour pictogram marked 14:00 includes the forecast from 11:01 until 14:00).
Day and night pictograms
Day and night pictograms show the weather condition for a period of one or three hour values during the day and night. They contain more detailed descriptions of weather conditions than the iday pictograms which represent a daily total of weather conditions.
| Daytime | Nighttime | Nr | Description |
|---|---|---|---|
 |
 |
1 | Clear, cloudless sky |
 |
 |
2 | Clear, few cirrus |
 |
 |
3 | Clear with cirrus |
 |
 |
4 | Clear with few low clouds |
 |
 |
5 | Clear with few low clouds and few cirrus |
") |
 |
6 | Clear with few low clouds and cirrus |
 |
 |
7 | Partly cloudy |

|
 |
8 | Partly cloudy and few cirrus |
") |
 |
9 | Partly cloudy and cirrus |
 |
 |
10 | Mixed with some thunderstorm clouds possible |
 |
 |
11 | Mixed with few cirrus with some thunderstorm clouds possible |
 |
 |
12 | Mixed with cirrus and some thunderstorm clouds possible |
 |
 |
13 | Clear but hazy |
 |
 |
14 | Clear but hazy with few cirrus |
") |
 |
15 | Clear but hazy with cirrus |
 |
 |
16 | Fog/low stratus clouds |
 |
 |
17 | Fog/low stratus clouds with few cirrus |
 |
 |
18 | Fog/low stratus clouds with cirrus |
 |
 |
19 | Mostly cloudy |
") |
 |
20 | Mostly cloudy and few cirrus |
 |
 |
21 | Mostly cloudy and cirrus |
 |
 |
22 | Overcast |
 |
 |
23 | Overcast with rain |
") |
 |
24 | Overcast with snow |
") |
 |
25 | Overcast with heavy rain |
 |
 |
26 | Overcast with heavy snow |
 |
 |
27 | Rain, thunderstorms likely |
") |
 |
28 | Light rain, thunderstorms likely |
") |
 |
29 | Storm with heavy snow |
") |
 |
30 | Heavy rain, thunderstorms likely |
 |
 |
31 | Mixed with showers |
 |
 |
32 | Mixed with snow showers |
") |
 |
33 | Overcast with light rain |
") |
 |
34 | Overcast with light snow |
 |
 |
35 | Overcast with mixture of snow and rain |
iday pictograms
iday pictograms show a summary of the daily weather condition. They are used in the API data feeds and on the meteoblue startpage (daily overview). The data feeds for 7 days forecasts use all the 17 iday picto- codes, the data feeds for 14 days use only the first 11 iday pictocodes. The json data feed also uses the 17 iday pictocodes.
| Pictogram | Nr | Description |
|---|---|---|
 |
1 | Sunny, cloudless sky |
") |
2 | Sunny and few clouds |
 |
3 | Partly cloudy |
") |
4 | Overcast |
 |
5 | Fog |
 |
6 | Overcast with rain |
") |
7 | Mixed with showers |
") |
8 | Showers, thunderstorms likely |
 |
9 | Overcast with snow |
 |
10 | Mixed with snow showers |
 |
11 | Mostly cloudy with a mixture of snow and rain |
") |
12 | Overcast with light rain |
 |
13 | Overcast with light snow |
 |
14 | Mostly cloudy with rain |
 |
15 | Mostly cloudy with snow |
 |
16 | Mostly cloudy with light rain |
 |
17 | Mostly cloudy with light snow |
Special pictograms*
| Daytime | Nighttime | No | Description |
|---|---|---|---|
 |
 |
18 |
Dusty desert dust; dry dust softened by the wind |
 |
 |
19 |
Blowing dust desert storm; storm or strong wind that carries sand or dust with it |
* Note: the special pictograms are only shown on our website and not included in the API
How the pictograms are calculated
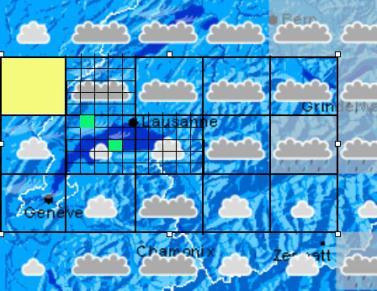
meteoblue pictograms show the most likely weather conditions for a location, based on a very detailed analysis of local forecast (black squares) in an area (yellow square). The area considered is within 20-30 km of the chosen centre point location (e.g. green points: Évian in Southeast and Morges in Northwest of square). For each point, a different pictogram is calculated. Main factors considered are:
- cloud cover: average of all cloud cover in the area.
- precipitation intensity: average of precipitation for the chosen location.
- precipitation type: prevailing precipitation for the chosen location.
- wind (if displayed): average or maximum wind for the chosen location.
Pictogram calculation combines the regional and local forecasts to match our perception: sunshine and cloudiness are perceived regionally, whereas precipitation, wind and temperature are perceived locally.
Download
Get our weather pictograms for free: you can use them with our or with your data, placing a link from your page to this page. All rights reserved.
meteoblue_weather_pictograms_2016-11-04.zip (4.85 MB)
All the other symbols used by meteoblue are available as font:
meteoblue_pictofont_rev13.zip (272 KB)

