Air motion
In this section, you can find variables and indices related to air motion in the atmosphere, that are used for thunderstorm and storm forecast, amongst others.
Vorticity
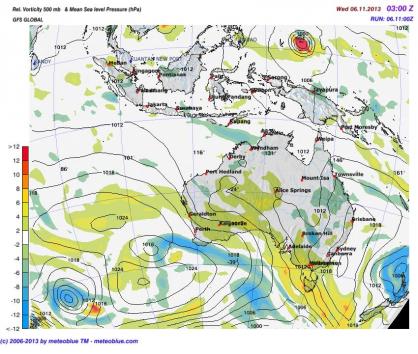
Relative vorticity is a measure of the rotation of fluids about a vertical axis relative to the Earth's surface. Colours indicate the strength of relative vorticity, red for positive (counterclockwise rotation) and blue for negative (clockwise rotation) vorticity, respectively. Isobars for air pressure are sometimes combined on the map. The maps are relative to a specific altitude (in hPa).

Positive vorticity at the 500 hPa level is often associated with cyclones and troughs in the 500 hPa
topography.
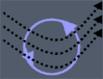
Positive vorticity develops in a wind field with counterclockwise curvature and/or due to shear
with higher velocities on the right, as seen in flow direction.

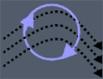
Negative vorticity develops in a wind field with clockwise curvature and/or due to shear with higher velocities on
the left, as seen in flow direction.
Negative vorticity at the 500 hPa level is often associated with fair
weather and ridges in the 500 hPa topography.
Vorticity is an important measure and used to locate dynamically active zones and fronts. The omega-equation, an equation used to diagnose vertical motion (or the so called omega, in pressure units) links vorticity and vertical motion. It says that: greater upward velocity occurs where there is greater advection of positive vorticity by the thermal wind.
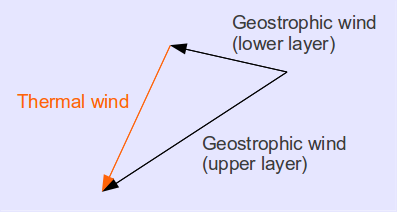
The geostrophic vorticity at the 700 hPa level is often used as a representative value for the omega equation. Now the thermal wind is only a mathematical construct (vector difference between geostrophic winds at two different heights or pressures) and not an actual wind. To examine the thermal wind, thickness maps are needed.
A thickness map between two different pressures (e.g 1000 and 500 hPa) is a measure of the average virtual potential temperature within that layer, where blue is cold and red is warm. The thermal wind is parallel to the thickness contours. Closer packing of thickness colours indicates a stronger horizontal temperature gradient and thus a stronger thermal wind. By the thermal wind relationship, the horizontal temperature gradient causes the geostrophic wind to change with altitude (how much is shown by a thermal wind vector).
Note that if thickness lines (layer temperature) cross pressure lines, there is a temperature advection (transport
of a warm air mass by the wind). The wind is parallel to pressure lines and stronger if isobars (lines of constant
pressure) are closer together.
Greater upward velocity favors clouds and heavier precipitation and that is
another good reason to look for vorticity. It may be complicated to evaluate vertical motion from vorticity, but
this has historical reasons. If you like it simple examine the plots of vertical velocity.
Helicity
Helicity is a measure of the intensity of rotation found in a storm's updraft air. Therefore, it is a variable that defines the intensity of streamwise vorticity (i.e. directional shear). If there is significant rotation in a storm's updraft air, the storm will likely become a supercell and possibly spawn tornadoes.
Helicity is expressed in m²/s². Values greater than 100 m²/s² indicates strong thunderstorm, whereas tornadoes are likely at >150 m²/s². Values for helicity are given for a specific depth range of the atmosphere (e.g. 0-3 km).
Note however that this should not be used as as automated tool to forecast tornadoes, it is rather one factor an experienced meteorologist considers together with many others when issuing tornado warnings.
CAPE
Convective Available Potential Energy (CAPE) is a measure of instability through the depth of the atmosphere, and is related to updraft strength in thunderstorms. It defines the amount of energy (in a parcel of air) which is available for convection. It is proportional to the maximum potential vertical speed within an updraft. CAPE is measured in joules per kilogram (J/kg). The higher the value, the greater the potential for severe weather like thunderstorms. For instance, a CAPE greater than 2500 J/Kg indicates a strong instability, whereas heavy thunderstorms may exceed 5000 J/Kg.
Imagine an air parcel as a balloon filled with air. Because warm air is less dense than cold air, the balloon rises as long as it is warmer than the surrounding. In this case, the balloon's temperature decreases with a rate of about 1 Kelvin per 100 metres. Therefore, the temperature of the atmosphere must decrease more than 1 Kelvin per 100 metres for unlimited rising. Now, the balloon has more energy than the surrounding because warm air contains more energy than cold air. This energy is available for the balloon's rise. In addition to that, higher humidity also increases the amount of energy. Together, temperature and humidity build the total amount of energy that is available for rising (in meteorological sense: convection), which is expressed with CAPE. Therefore, CAPE is based on the properties of the balloon's air (air parcel) in comparison to the surrounding. For instance, CAPE is higher with a greater temperature difference between the parcel of air and the surrounding. Together with CIN, CAPE may give you information about the possibility of thunderstorms.
Convective inhibition
Convective inhibition (CIN) represents the amount of energy an air parcel needs to reach the level of free convection (convection: see also convective updraft). It is expressed in joules per kilogram (J/Kg). Heavy thunderstorms are unlikely if the convective inhibition is large, although the presence of CIN does not preclude thunderstorm development as long as it is not too high. For instance, low CIN (<50J/kg) indicates a weak atmospheric cap that can easily be broken by surface heating, whereas high CIN (> 200J/kg) impedes a thunderstorm development. CIN is given as one value through the depth of the atmosphere as it is independent of altitude.
Imagine an air parcel as a balloon filled with air. The balloon rises as long as the temperature is higher than the surrounding. But if the surrounding temperature is higher, rising is impeded. Therefore, the balloon must be taken to a level where it can rise freely, which is the level of free convection. This action requires a certain amount of energy, that is expressed with convective inhibition. Thus, CIN simply describes the energy that is needed until the air parcel can rise on its own, because it is warmer than the surrounding.
Together with CAPE, CIN gives you information about the possibility of thunderstorms for example.
Convective updraft
Convection is the vertical transport of rising air in the atmosphere as a result of atmospheric instability. It can lead to condensation and cloud formation. Warm air masses rise when there is a positive lapse rate. Therefore, convection occurs when the sun warms the ground and the lower atmosphere for example. Warm air rises due to the fact that it is less dense than cold air. This means that warm air is lighter than cold air in same pressure conditions and therefore keeps rising as long as it stays warmer than the surrounding. Thus, the stimulating factor for convection are density differences. It is the same principle as in water environments: Imagine a balloon filled with air that you put under water. What happens is that the balloon immediately rises to the surface, simply because it is less dense than water, similar to convection in the atmosphere.
Convective updraft describes the velocity of the rising air masses. High velocity is an indication of strong upward air currents. Velocities are expressed in metres per second (m/s). Convective updraft occurs up to the level where convection stops due to atmospheric stability. In this vertical extent, velocities are given as a value independent of altitude.
Coupled with high humidity, High convective updraft is an indication of thunderstorm risk.
Lifted index
The temperature value of the ground is computed and compared with the actual temperature at a specific pressure height. The difference between both values is the lifted index. Therefore, the lifted index (LI) is a dimensionless measure of atmospheric instability and is expressed with values between -6 and +6.
The air is stable for positive index and unstable for negative index numbers.
| LI | conditions |
|---|---|
| > 6 | very stable conditions |
| 1 to 6 | stable conditions, thunderstorms not likely |
| -2 to 0 | slightly unstable, thunderstorms possible with presence of lifting mechanism (e.g. cold front, daytime heating etc.) |
| -6 to -2 | unstable, thunderstorms likely, some severe when lifting mechanism present |
| < -6 | very unstable, severe thunderstorms likely with lifting mechanism |
LI is mainly used for thunderstorm forecasts. For instance, negative values indicate stronger updrafts where thunderstorms may develop. On the other side, a lifted index of zero or higher indicates stable conditions, where thunderstorms are unlikely. In maps, the lifted index is given as value independent of altitude.
K-index
The k-index (dimensionless) is used as a measure of the thunderstorm potential and to forecast heavy rain. It depends on temperature and humidity and is based on the following equation:
k-index = 850 hPa Temperature - 500 hPa Temperature + 850 hPa dew point temperature - 700 hPa dew point deficit
A higher k-index value generally means a greater thunderstorm potential. However, the k-index does not work well with synoptic scale low pressure systems, whereas it works best for air mass thunderstorm development. Further, the k-index should not be used to determine thunderstorm severity.
| k-index | Thunderstorm potential |
|---|---|
| < 20 | thunderstorms unlikely |
| 20 to 25 | isolated thunderstorms |
| 26 to 30 | scattered thunderstorms |
| 31 to 35 | few thunderstorms |
| 36 to 40 | numerous thunderstorm |
| > 40 | very high risk for thunderstorms |
The k-index is independent of altitude, as it is computed with variables in different altitudes. Therefore, there is one value shown per atmospheric column in maps.

