
Spatial dimensions
meteoblue provides weather information on different spatial aggregations, which can be visualised in images and maps or obtained as raw data. These show weather information from the local point to continents and from surface to atmosphere. meteoblue offers images and data for different spatial dimensions which are presented below and explained in more detail on the respective pages.
All these dimensions are available as image or raw data for any place in the world, for various time dimensions.
Click on the sub-section of interest (more information button) to have more details.
Local forecasts

point
Your place – weather information scaled down to the selected place, anywhere in the world.

spot
Your area – weather information for the surrounding area, giving an overview of conditions.
Dynamic weather maps
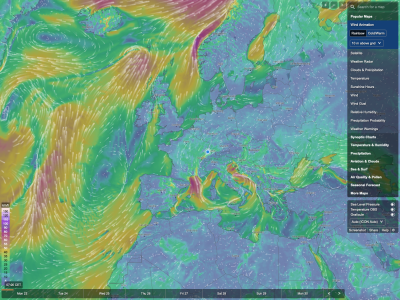
Dynamic weather maps
Within the dynamic weather maps tool all kind of weather variables from different data sources can be displayed for each time point. The interactive tool allows you to zoom in from a global overview down to local scale.
Aviation
For aviators we offer specific functions, that visualise the atmospheric layering:
air
Forecasts for atmosphere layers, as vertical profiles, sections or trajectories.
Raw model data
Numerical weather models are defining their space by dividing it into grid cells. These are generally refined to the point by applying different post-processing methods as downscaling, multi-modelling and others. Raw data for large areas can be retrieved in gridded format:

grid
Data sets covering larger areas for defined weather variables, available for professional customers.

