
Accuracy Considerations
This page covers the following topics:
- Inconsistencies in precipitation maps due to different model resolutions
- Lower accuracy with highest resolution raw model
- Weakness of weather simulation models in tropical regions
- Other spatial datasets available for comparison
- Increasing weakness of satellite observational datasets with growing equatorial distance
- Inconsistencies within merged time series from different models
- Overview of extensive long-term verification studies conducted
Precipitation event and amount simulations as well as actual precipitation amounts are some of the most important variables in meteorology, that simultaneously show a highly variable occurrence over small distances, due to their complex physical nature, and are therefore amongst the most difficult variables to simulate with high precision.
Whilst we are continuously working on improving our simulations, with this page we want to ensure that our users are aware of some of the most important accuracy issues related to precipitation forecasts, in order to be able to interpret the data and potential shortcomings correctly.
In general, it is important to differentiate between precipitation amount accuracy and precipitation event accuracy, with sometimes diverging results. When accuracy measures are evaluated, please think about your priorities first: is a precipitation event the most important criteria (i.e. is it important whether tomorrow is totally dry or sees some rainfall) or the precipitation amount (i.e. is it important whether it rains 10 or 30 mm in the next 2 days).
Inconsistencies in precipitation maps due to different model resolutions
The meteoblue weather maps automatically select the data from the most adequate model, which changes with the map view area and zoom level (for example, for central Europe, zoom level 4 shows the NEMSGLOBAL data, zoom level 5 shows the NEMS12 data, and zoom level 6 shows the NEMS4 data).
For precipitation, this has the consequence that the low resolution maps appear to show a wider spatial precipitation distribution than the high resolution maps. Conversely, while the high resolution maps show a more narrow spatial precipitation distribution, they show higher local precipitation amounts.
This can be explained easily: If one grid cell with a resolution of 30x30 km is composed by 3x3 grid cells with a resolution of 10x10 km, and if one of these smaller grid cells has simulated a thunderstorm, the whole 30x30 km grid cell in the low resolution view will show a thunderstorm, and be painted blue (= precipitation is present), as it can not distinguish in which part of the grid cell the thunderstorm occurs: the low resolution model just knows that precipitation will occur somewhere within the large grid cell. And simultaneously, it will average the precipitation amount of this local event over the whole grid cell, which will reduce the intensity.
Lower accuracy with highest resolution raw model
Our verification studies showed that the accuracy of the precipitation simulation from the highest resolution model (4 km in Europe) is lower on average than from the lower resolution models (12 km and 30 km), due to the small-scale occurrence of precipitation events.
This can be understood easily by imagining a small thunder storm which moves ahead with a track that in reality is offset by 2 km from the simulated track (which easily can happen). Now, with a grid cell of 4 km, it is likely that the actual track goes through different grid cells than the simulated track. As a result, the simulation will produce two wrong grid cell tracks (one where the thunder storm was simulated but didn’t pass and one where no thunder storm was simulated but actually passed) because of a single thunder storm. Going to a lower resolution model reduces this issue, as the shift between simulated and actual track has to be much larger in order to have the same probability of predicting two grid cell tracks wrong simultaneously.
The most precise raw model results are found with a spatial resolution of 6-12 km. The 12 km simulation proved to be more accurate than the 30 km resolution simulation. Exceptions of this results are found in mountainous areas, where the higher resolution models produce better precipitation accuracy than the lower resolution models, because the former have a better grasp of the topography.
When using meteoblue data, you will receive the following model output:
- In the history+ interface (if the high-resolution precipitation data is selected) as well as in the history API (if no domain is selected), not the highest, the medium resolution model (12 km for Europe) is extracted automatically, instead of the highest resolution model (4 km for Europe). You have the choice of selecting the low resolution model for long-term data.
- For data requested specifically from a specific model, you will receive that model data. Some data gaps may be filled with data from the lower resolution model. Such gaps can be indicated on demand
The forecasts (for the API: when no domain is specified) do not differentiate between models, as the delivered data is a multimodel composition to which no specific resolution can be attributed; this issue does therefore not apply. Yet, the historic data series will not be able to exactly reproduce the multi-model forecast, as the availability of the models at the time of forecast production can not be reproduced exactly in hindsight. If a verification of historic precipitation forecast is needed, the actual precipitation forecast should be stored at least once each day.
Weakness of weather simulation models in tropical regions
In tropical regions (as well as in regions with heavy monsoon rainfalls), precipitation simulation is especially difficult. This is due to the high occurrence of precipitation events, with large amounts of rain in short times. Furthermore, convective precipitation as well as precipitation during thunder storm events is more common. Both of these precipitation forms can be very complex and locally highly inconsistent, and therefore are even more difficult to simulate precisely, compared with other forms of precipitation.
The implication of this difficulty in precise simulation is that the precipitation amount in tropic regions generally is clearly underestimated (exceptions apply, which makes a systematic correction very difficult).
Other spatial datasets available for comparison
In order to address these accuracy issues with precipitation simulations, next to our own models, meteoblue collects and distributes a wide range of different precipitation datasets from third-party operators.
Next to a high number of own global (2 models) and regional models (14 models), the database of meteoblue also contains forecast models like GFS (NOAA) and ICON (DWD), reanalysis models like ERA5 (ECMWF), satellite observational datasets like CHIRPS2 and CMORPH that are further improved by corrections with precipitation measurements, as well as radar data in some regions (due to various reasons, no comprehensive radar data for the whole world can be offered). As all these datasets come with different strengths and inaccuracies, and there can be big differences in accuracy, depending on time and location of inquiry. More is shown on our verification pages.
In conclusion, it is not possible to easily define one dataset to have the best accuracy for all uses and locations. Furthermore, without high quality measurement within reasonable distance, it is difficult to estimate which dataset has the best quality in this situation. For further information concerning the quality of the different datasets, please consult our precipitation verification page.
With the meteoblue history- and forecast-APIs, by setting the domain-attribute to the desired model, specific precipitation simulation data can be collected.
With the historical precipitation API all abovementioned datasets can be delivered for specific customer needs regarding precipitation.
For history+ we will release an extended version this year, which makes all different precipitation datasets available through the popular interface.
Increasing weakness of satellite observational datasets with growing equatorial distance
The CHIRPS2 as well as the CMORPH datasets are produced by geosynchronous satellites, which are placed over the equator, cycling around the Earth with the same speed as the Earth rotation. Therefore, their view at equatorial areas is precise and rectangular, while in higher latitudes, the satellite view has to go through more atmospheric layers, at a smaller angle. Therefore, the quality is best in equatorial areas and decreases steadily towards the poles.
CHIRPS2 only is available for regions between 50°S till 50°N, and CMORPH only between 70°S-70°N. However, it is suggested that these datasets are used even more restrictively, from 45°S to 45°N or even between 30°S and 30°N only. From our most recent verification studies, it can be seen that for locations farther away from the equator, other precipitation datasets show the better accuracy.
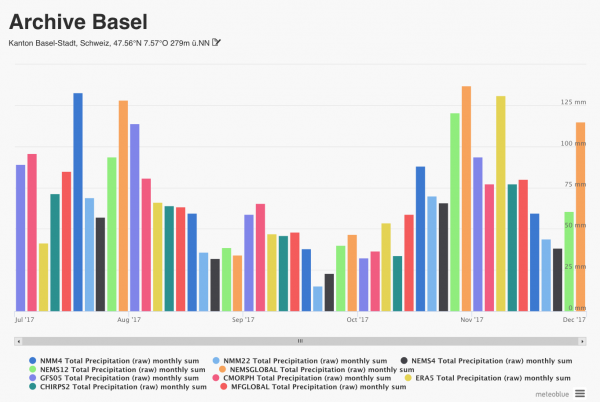
Inconsistencies within merged time series from different models
As the inconsistent nature of precipitation does not allow meaningful bias-correction (just as MOS-postprocessing does also not provide improvements) as it can be done automatically for other variables, merging of different models and time series is not possible without leaving substantial data inconsistencies.
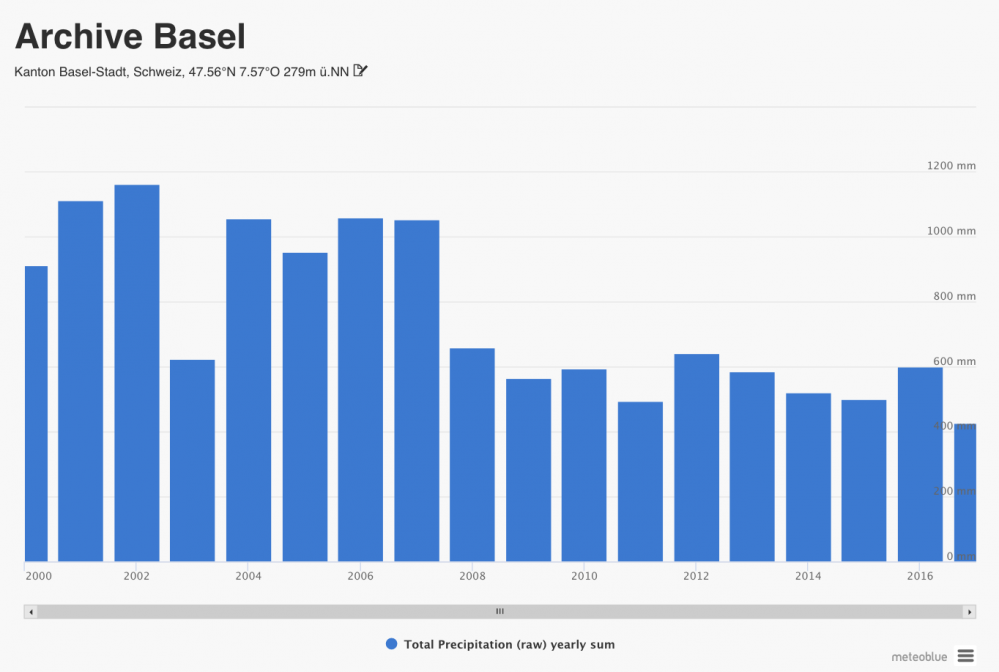
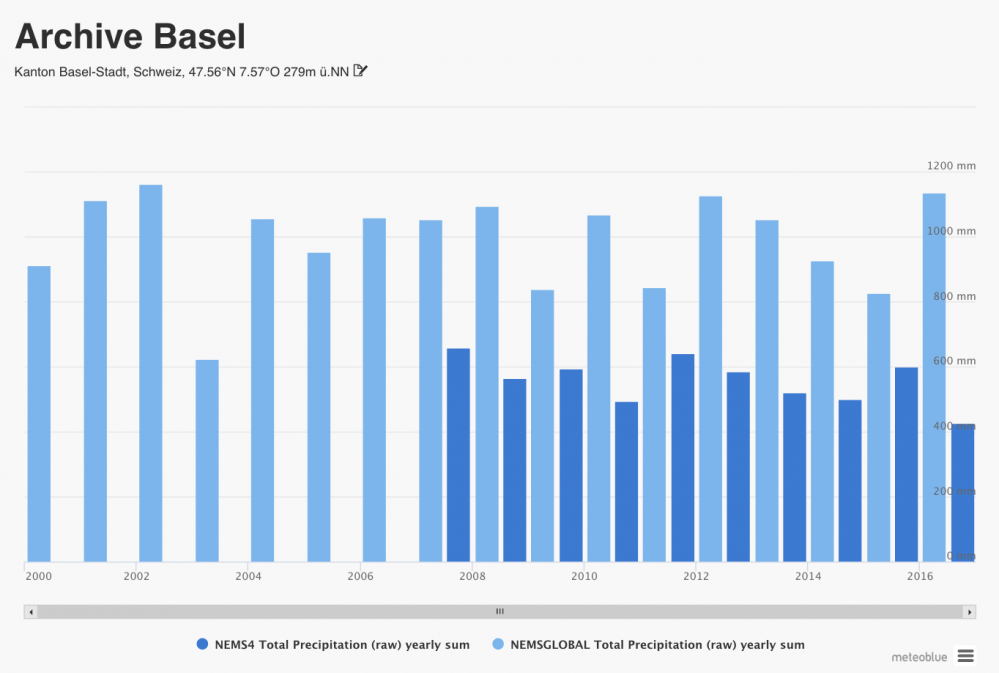
This is important to consider when collecting long time series of precipitation data from the meteoblue history API. When no domain (or a local domain) is specified (which is suggested in general and for most other variables), the API delivers high-resolution data, starting with the implementation of the most high resolution current model. When data from earlier dates is requested, the API delivers low resolution data from the NEMSGLOBAL model (going back till 1985). In order to avoid this inconsistency, we suggest the use of a specific historical precipitation API, additional to the regular history API, which remains the most suitable for all other variables.
Within the history+interface, it is important that the correct precipitation dataset (“high resolution, limited time range” or “low resolution, since 1985”) is requested, depending on the specific requirements of usage. Note that when for a specific location no local model exists at all, the “high resolution, limited time range” delivers the low resolution global model anyway. The resolution available locally can be confirmed easily by looking at the grid cell size of the rainSPOT.
The forecast data is the result of a multimodel composition, to which no specific resolution can be attributed, so this issue does not apply.
Overview of extensive long-term verification studies conducted
meteoblue conducts extensive long-term verification studies in order to understand the quality of the precipitation data, produced by its own models as well as by various third-party operators, compared to several thousand precipitation measurement stations.
Generally speaking, good precipitation simulation can estimate 85% of dry/rainy hours correctly, with a Heidke Skill Score from 0.3 – 0.6 for events larger than 1mm/day. Concerning the precipitation amounts, 90% of the simulation data has an accuracy of +- 30% compared to measurements.
Post-processing methods, such as multimodel-mixing or MLM, are able to bring the precipitation simulation accuracy to a higher level.
For further information and the latest verification reports, consult our precipitation verification page.

