Highest publicly documented accuracy of weather data for any location worldwide
meteoblue delivers unparalleled precision in weather forecasting, offering the highest publicly documented accuracy for any location across the globe. Our commitment to quality is underscored by our Swiss heritage, ensuring reliability and excellence in every data point. We excel in distilling vast amounts of weather data into concise, actionable insights that empower your effective decision-making. The following provides a brief overview of the processes involved in bringing about these high levels of accuracy, as well as further reading.
- Transparently documented accuracy levels for weather data
- We use more than 30 different weather simulation models
- Real-time satellite and radar animations for any place worldwide
- Trusted by more than 72 million website users - see what they say
- First choice of 3000 business customers from more than 100 countries
- Operating more than 100.000 weather stations in real time
- More than 99.99% availability of our Weather API in the last 5 years
Weather close to you: Hyperlocal real time forecasting

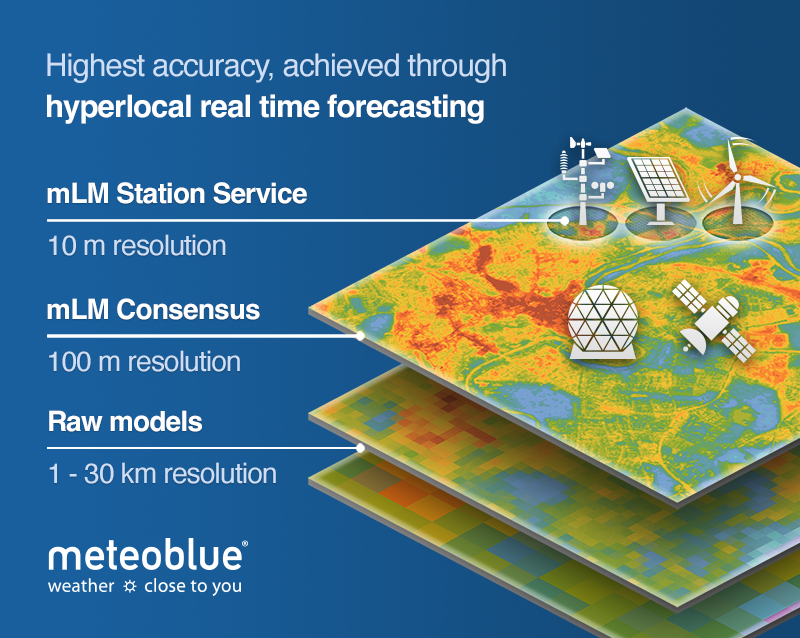
The weather forecast models provide only a coarse resolution of 1-30km, which describes the general weather patterns well enough (“Tomorrow we expect sunny, warm weather in Northern Italy”), but has its limit if we need more localised information (“14,5° C and 10mm of rain tomorrow between 15-16h in Milano”).
meteoblue has developed hyperlocal models to downscale the spatial resolution to 10m with the highest possible accuracy.
Combining all available data sources in an operational process chain
With our unique and complex process chain comprising cutting-edge technology and a large variety of data sources, we achieve the highest documented accuracy and precision.
As the diagram above indicates, we rely on WMO weather stations, soundings, and satellite data, as well as a global observing system and global assimilation to feed our models. The global models, as well as limited area model outputs, are a major part of the input for the meteoblue Learning MultiModel, our proprietary technology. Other sources of data are partner weather stations with limited area assimilation, rain radar, and other weather stations. Together with historical data, observations, and our quality assurance, the meteoblue Learning MultiModel (mLM) finds the best weather forecast.
Depending on the weather situation, the location, the season, or the specific time, a forecast from one numerical weather model might be more accurate than that from another one. That is why we use data from over 30 weather models and forecasts made by national weather services and scientific institutions around the world, and combine them with our artificial intelligence to create the most probable forecast.
Our data is then available via API and plugins on meteoblue.com, as well as other partner systems and websites, and comes in a multitude of forms: simple weather symbols, precise meteograms, rainSPOT, Weather Maps, archives for historical weather, and others.

Unique data range: Hundreds of weather variables and data sources
We process terabytes of data every day to achieve the highest possible accuracy by combining a wide range of data sources:
- Proprietary & third-party weather models
- Measurements from weather stations
- Real-time satellite images
- Rain radar observations
- Digital elevation model
- Land use classifications
For more information please consult our data sources page
Scientific principles: Continuous verification and enhancement
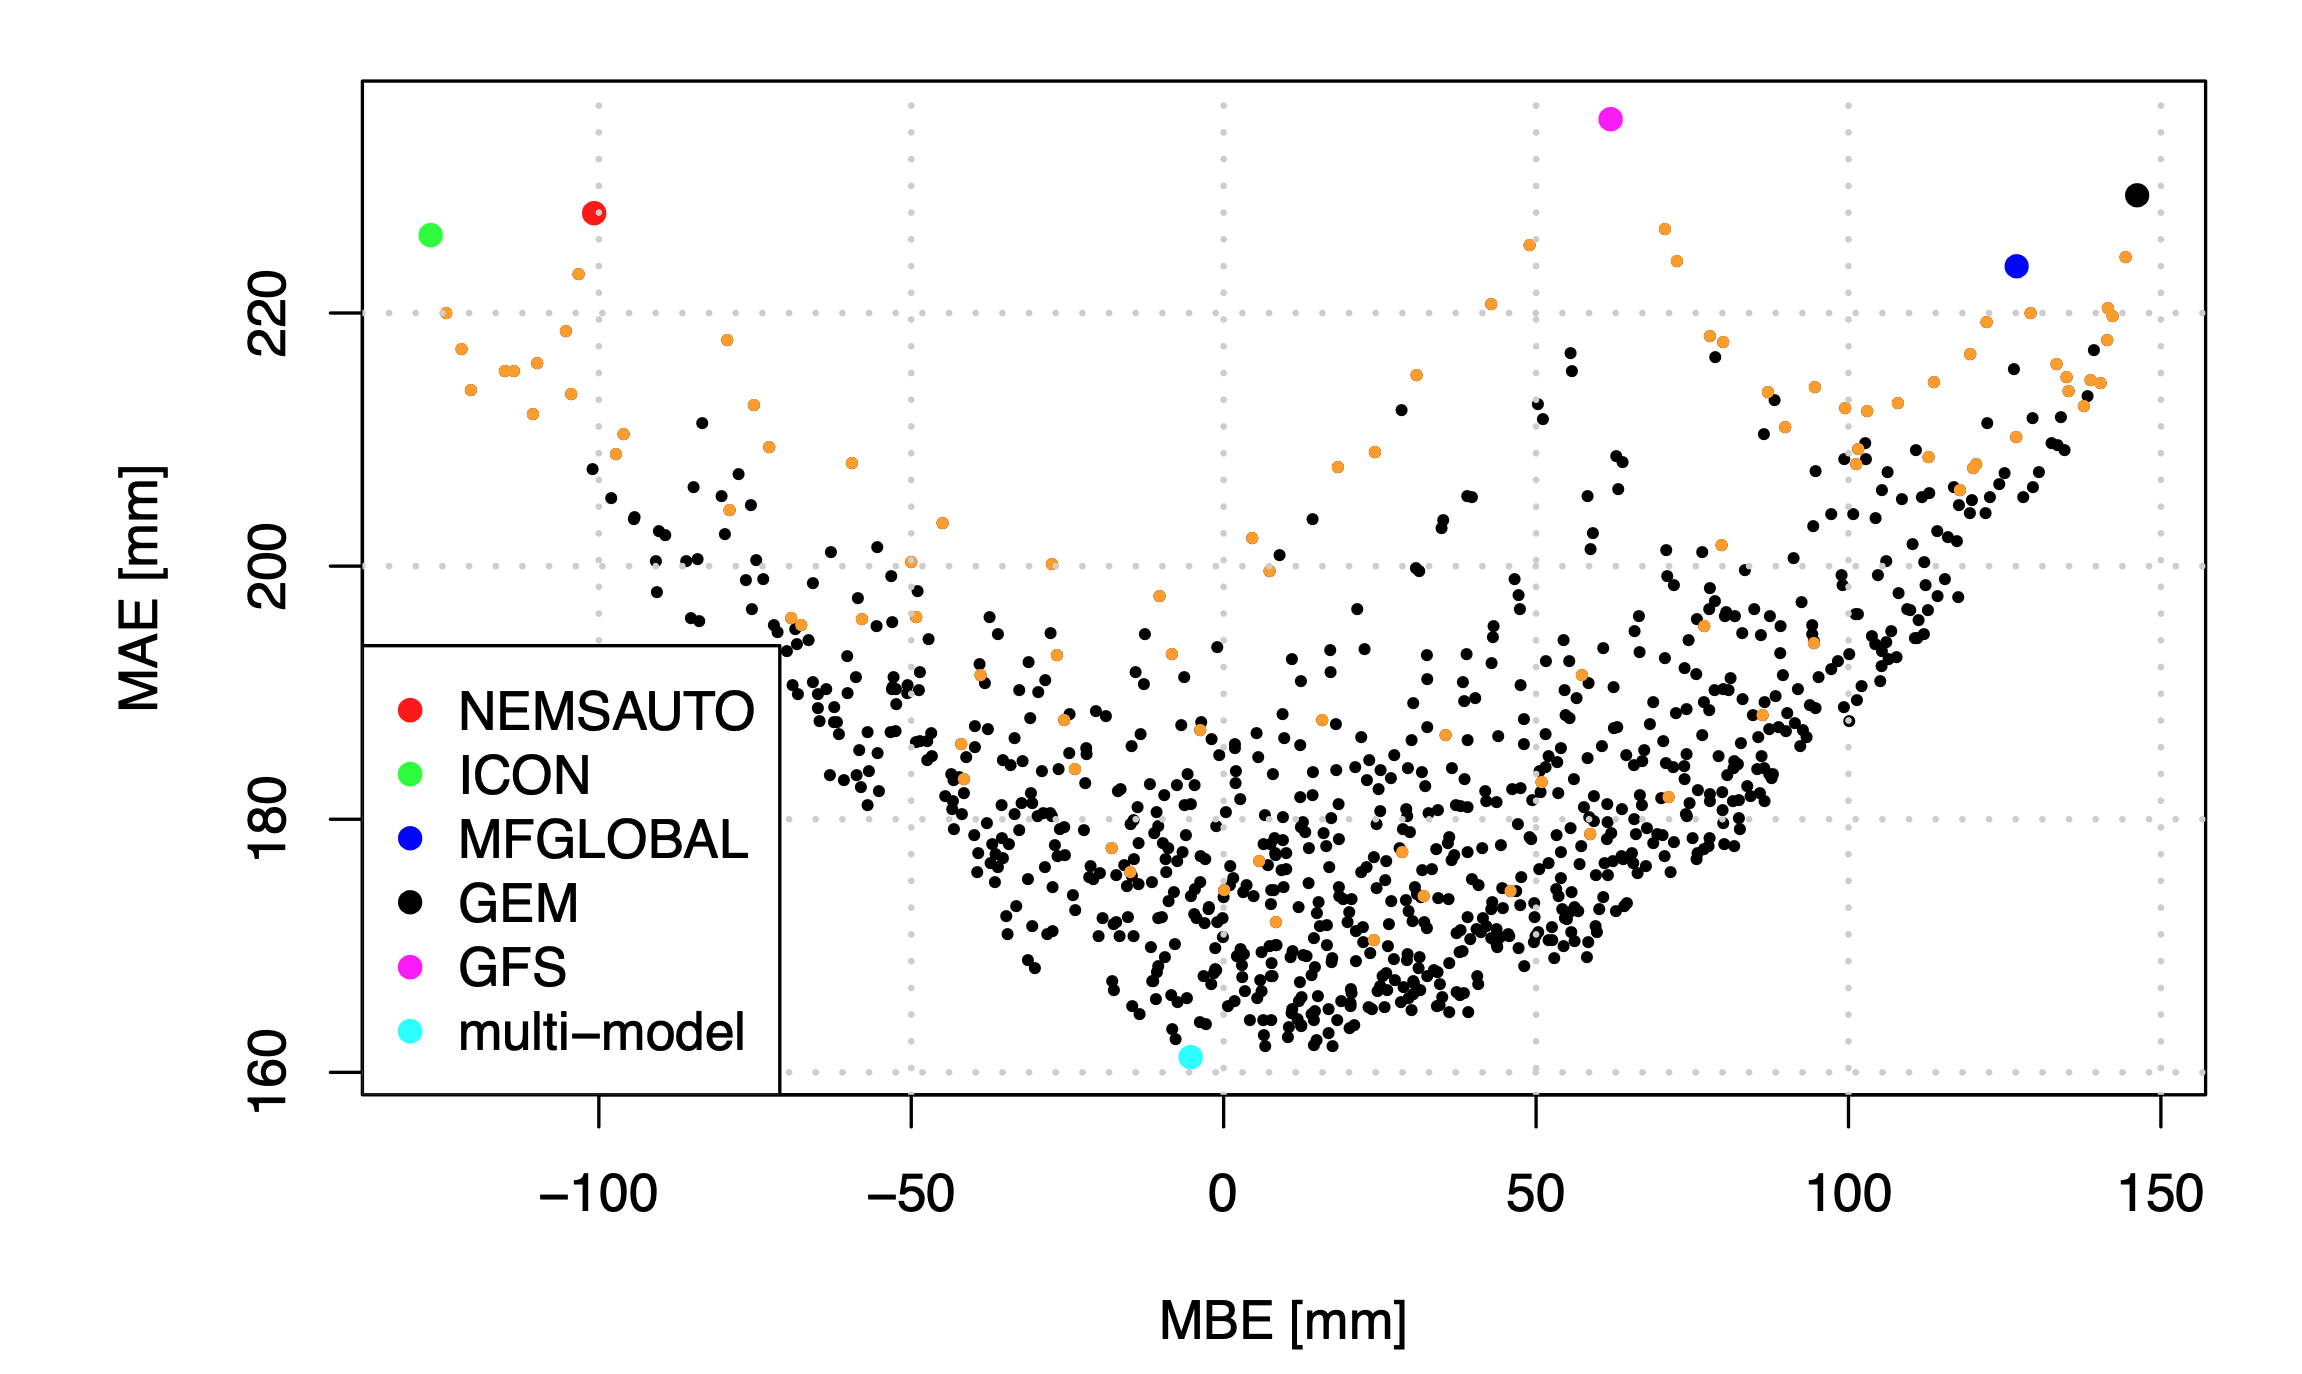
We constantly compare our operational forecast with measurements from hundreds of thousands of weather stations worldwide, as everyone can check on our short-term verifications page. We conduct scientific verification studies for our proprietary and third-party weather models, and publish them on our weather data accuracy pages. Therefore, we use different scientific error measures such as Mean Absolute Error (MAE), Mean Bias Error (MBE), Heidke Skill Score (HSS) and many more. The following table offers an overview of the mean error values (MAE) of different model approaches for the main weather variables:
| Model approach | Air temperature | Wind speed | Annual precipitation | Dew point temperature | |
|---|---|---|---|---|---|
| Forecast | meteoblue Learning MultiModel | 1.2 K | - | 170 mm | - |
| MOS | 1.5 K | 1.2 m s-1 | - | 1.7 K | |
| Weather forecast models | 1.7 - 2.2 K | 1.5 - 1.7 m s-1 | 220 - 230 mm | 1.9 - 2.4 K | |
| History | Real-time updates (NEMS30) | 2.1 K | 1.7 m s-1 | 220 mm | 2.2 K |
| Reanalysis model | 1.5 K | 1.5 m s-1 | 120 - 180 mm | 1.6 K |
These error measures can also be used to show the potential of multi-models to improve the forecast by detecting the ideal combination of 5 different weather models:

Further scientific verifications

Weather data accuracy
meteoblue produces weather data with the highest publicly documented accuracy. In this section we elaborate on how exactly we verify the top accuracy of our meteorological services and provide detailed error metrics for different variables and data sources of historical and forecast data.
Transparency: Comparing meteoblue to competitors
To prove that we can outperform our competition, we compare our operational forecast with other providers (even if we have to pay for their data). The comparison of precipitation and temperature data from 475 weather stations confirmed that meteoblue is overall the most accurate provider for Day-Ahead forecast:
| Raw Model | MAE [°C] | MBE [°C] | (HSS) Events > 0.1 mm |
(HSS) Events > 1 mm |
(HSS) Events > 10 mm |
|---|---|---|---|---|---|
| meteoblue | 1.29 | -0.16 | 0.51 | 0.49 | 0.37 |
| Provider_A | 1.61 | -0.52 | 0.40 | 0.44 | 0.33 |
| Provider_B | 1.26 | -0.02 | 0.42 | 0.47 | 0.36 |
| Provider_C | 1.48 | -0.21 | 0.44 | 0.47 | 0.35 |
| Provider_D | 2.03 | -0.23 | 0.36 | 0.37 | 0.23 |
Accuracy vs. precision
In the context of weather forecasting, precision refers to the level of detail and resolution in the forecasts, while accuracy refers to the degree to which the forecasts match the actual weather conditions

Precision generally refers to how close measurements of the same item are to each other. For a weather data provider such as meteoblue, precision involves both the spatial and the time dimension. Specifically, this means having unique spatial dimensions from point to grid, and unique time dimensions from the past, nowcast, forecast to climate predictions.
To illustrate this via an example: a weather forecast with high precision might provide detailed predictions for specific locations and time periods, while a forecast with lower precision might provide more general information that covers a larger area or time frame.
Accuracy, on the other hand, refers to how close a forecast is to the true or accepted value of a measurement. We believe that the highest accuracy and transparency are needed to be a reliable provider of weather data. Accuracy therefore refers to how well the forecasts match the actual weather conditions. A weather forecast with high accuracy would correctly predict the temperature, precipitation, and other weather conditions most of the time, while a forecast with low accuracy would frequently be incorrect or only partially correct.
Do not just take our word for it - experience our weather data yourself
We offer you more weather forecast and historical weather data for any place in the world, more precision, and more details than anyone else, for free.
For a full overview of our wide range of products and services, both commercial and free to use, visit our one-stop weather-shop.


